Now that you've learned how to view and use dashboards, this tutorial will show you how to view and use saved Looks.
You can view and interact with Looks as much as you want without impacting other Looker users. The only way to impact anyone else is if you select the Edit button and make changes (visit the Saving and editing Looks documentation page to learn more). Once you've mastered viewing Looks, learn more about exploring data and creating visualizations.
Finding and viewing Looks
Looks and dashboards can be organized in several ways:
- In folders (for example, you can have folders named Marketing, Q4 Sales Review, and so on).
- You can navigate your company's folders by expanding the list of folders in the Folders section of the left navigation panel.
- On boards.
- You can navigate your company's boards by expanding the list of boards in the Boards section of the left navigation panel.
- On your Looker homepage.
You can open a Look by selecting the Look's name or thumbnail icon, depending on whether content is organized in grid view or list view.
The Look page
A Look's page consists of the following elements:

- The title of the Look and the name of the folder in which it is saved.
- You can select the heart icon next to the Look's title to add the Look to your Favorites folder.
- Information about how many rows are in the Look, how long the query took to run, and how old the data is.
- How long ago the data was queried (to display the date and time, hover over the relative time information).
- The time zone of the data you're viewing, if your admin has enabled user-specific time zones.
- The Explore actions gear menu.
- The Details panel that displays information about the Look.
The remaining items can be expanded or hidden as desired:
- The Filters section displays a list of filters that have been applied to the Look, if any. If the Look was created with adjustable filters, you can temporarily change them to limit the Look to only display the information that you're interested in. Just remember to rerun the query using Runbutton in the upper right after making any changes.
- Unless you select Edit and make the change in edit mode, changes to the filters are temporary and do not impact other Looker users.
- The Visualization section that displays the Look's data.
- The tooltip that displays additional details about each data point, which you can reveal by hovering over a point on the visualization.
- The Data table that displays the underlying data of the Look. In the Data table, you can adjust the following Look elements:
- Field sort order. Select a column heading (or several using the Shift key) to sort the values in the column. Looker will adjust the results and automatically rerun the query if necessary.
- Row and column limits. After making changes to the limits, be sure to select the Run button in the upper right to run the query with the new limits.
Unless you select Edit and make the change in edit mode, changes to the sorting or limits are temporary and do not affect anyone else.
- If a field has a description defined in its LookML, hovering over the table column header in the Data table will display the description.
- Depending on your permissions, next to each dimension or measure label you may access a gear icon that provides a Go to LookML link for Looker developers to view the field's LookML definition.
If you make any changes while viewing a Look, such as changing filters, sorting a column, or changing row limits, you can return to the Look's original settings by selecting Reset Look.
As you gain familiarity with Looker, you can also select the Explore from Here option to use the Look as a starting point for further data exploration. You can start with one set of data and then begin exploring the answers to related questions by changing the filters, changing the visualization, sorting the data differently, or by making other changes. You can learn about these exciting possibilities on the Exploring data in Looker documentation page.
The Look Explore actions gear menu
The Explore actions gear menu on a Look's page lets users use or customize their Look in several ways, depending on their permissions in Looker. Depending on user permissions, the options can include the following:
- Save — Select this option to:
- Save a Look as a query tile or Look-Linked tile to a new dashboard.
- Save a Look as a query tile or Look-Linked tile to an existing dashboard.
- Save a copy of the Look in another folder.
- Download — Select this option to download the contents of a Look in one of several format options.
- Add to a board — Select this option to add a Look to an existing board.
- Send — Select this option to send a Look as a one-off delivery.
- Schedule — Select this option to set a recurring delivery for a Look.
- Share — Select this option to obtain a link that you can copy and paste to share with other users.
- Get embed URL — Select this option to generate either a private embed URL or a signed embed URL, which you can use to embed the Look into an iframe.
- Get LookML — Select this option to get a Look's query and visualization LookML elements to add to a LookML dashboard, an aggregate table, or a native derived table.
- Edit settings — Select this option to enable or disable the Run on Load or Public Access options. Only the Run on Load option is enabled by default.
- Merge results — Select this option to merge the result of a Look's query with the results from other queries.
- Clear cache and refresh — Select this option to override any data caching policies and force new results to be generated from the database.
- Move to trash — Select this option to delete a Look.
The Details panel
The Details panel on the right side of the Look page lets users quickly access additional details about a Look. Users can also use the Details panel to customize and use their Look in several ways, depending on their permissions, including:
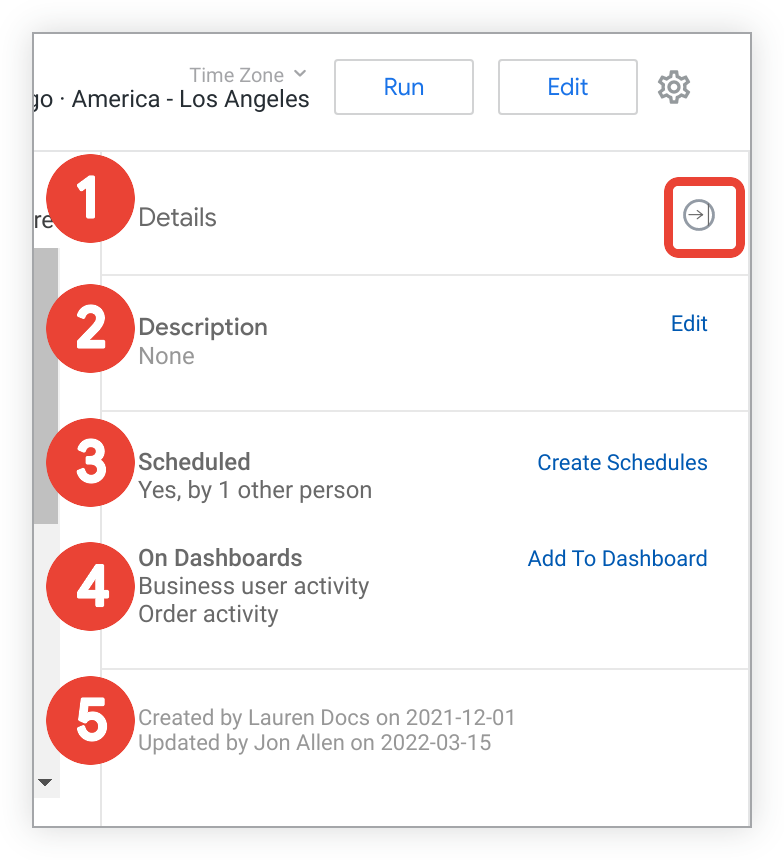
- Expanding or collapsing the Details panel by selecting the circle-arrow icon.
- Viewing or editing a Look's description in the Description field.
- Viewing the schedule activity of a Look in the Scheduled section, including creating or editing existing schedules you have created for a Look.
- Viewing a list of dashboards in the On dashboards section that the Look has been added to as a Look-linked tile, or adding the Look as a query tile or Look-Linked tile to a new or an existing dashboard. You can view a dashboard by selecting the name of a dashboard from the dashboard list.
- Viewing the history of updates to a Look's settings by users.
Choosing time zones
If your Looker admin has enabled user-specific time zones, Looker provides a drop-down menu for time zone selection.
Select the current time zone displayed in the upper right of the Look page to choose a new time zone.
The time zone setting affects the data returned when filtering for "today", "yesterday", and so on. You can learn more on the Using time zone settings documentation page.
Drilling into a Look
You may be able to drill into a data point on your Look to learn more about it. You can drill in one of two ways:
Drilling into a Look's data table
You may be able to drill into a value in a Look's data table, if it is enabled by your Looker developers.
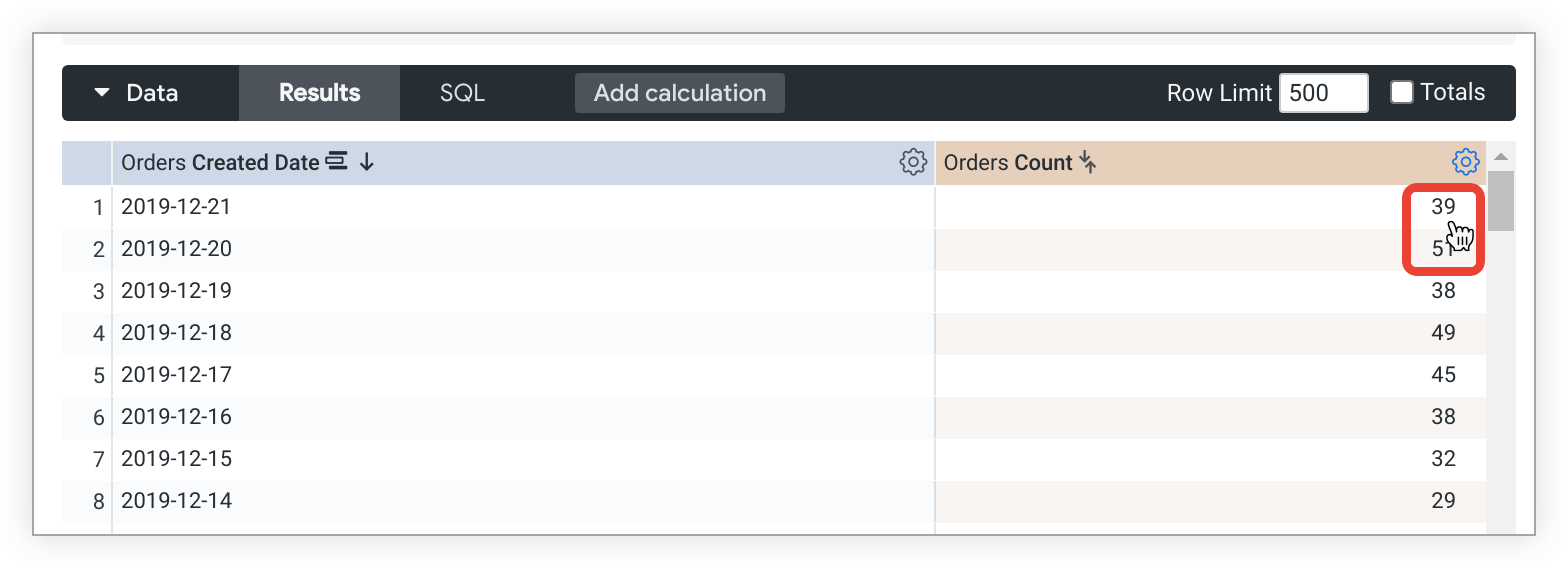
For example, the Data table of a Look titled Order count by date shows that December 21, 2019 has had 39 orders. Selecting the Orders Count value of 39 displays details about those 39 specific records.
Looker then displays a Details window with a data table about those 39 orders.
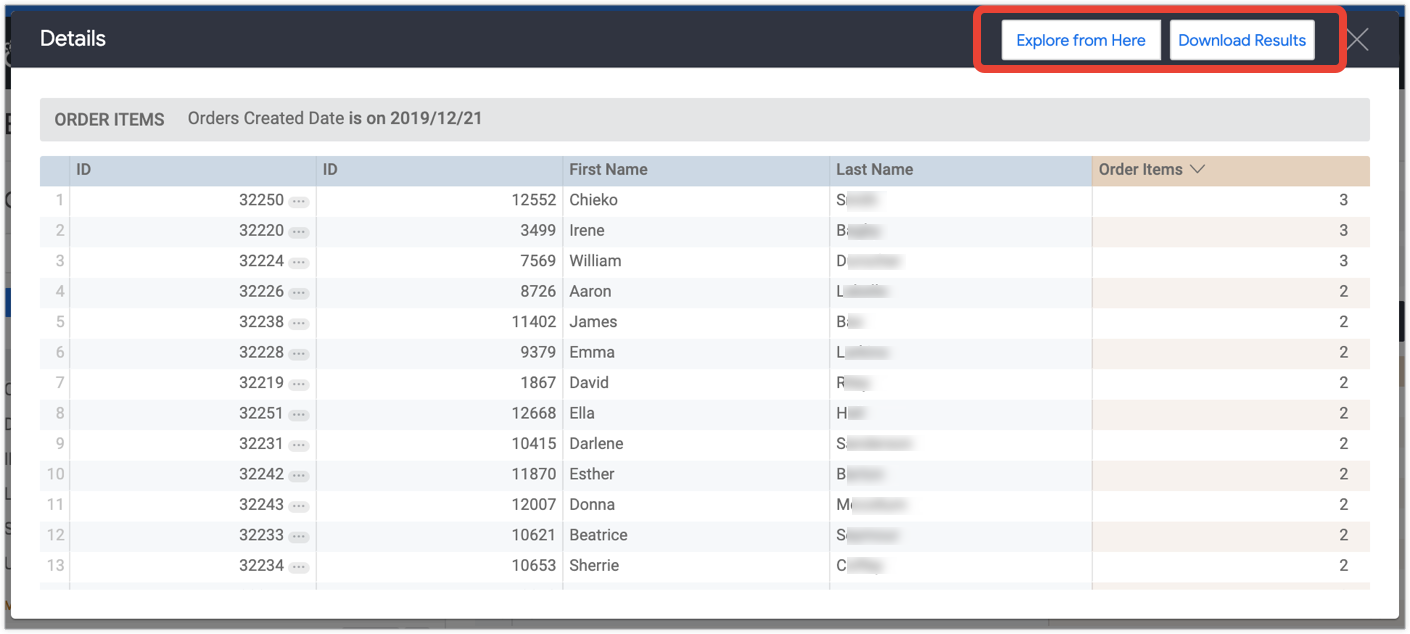
For datasets where the row limit is reached in the Details window, Looker provides a link for downloading the complete set of results. Select the Download Results link at the top of the Details window to download the data, using the same options as shown on the Downloading content documentation page.
You can also select Explore from Here to use the drill details as a starting point for a new Explore.
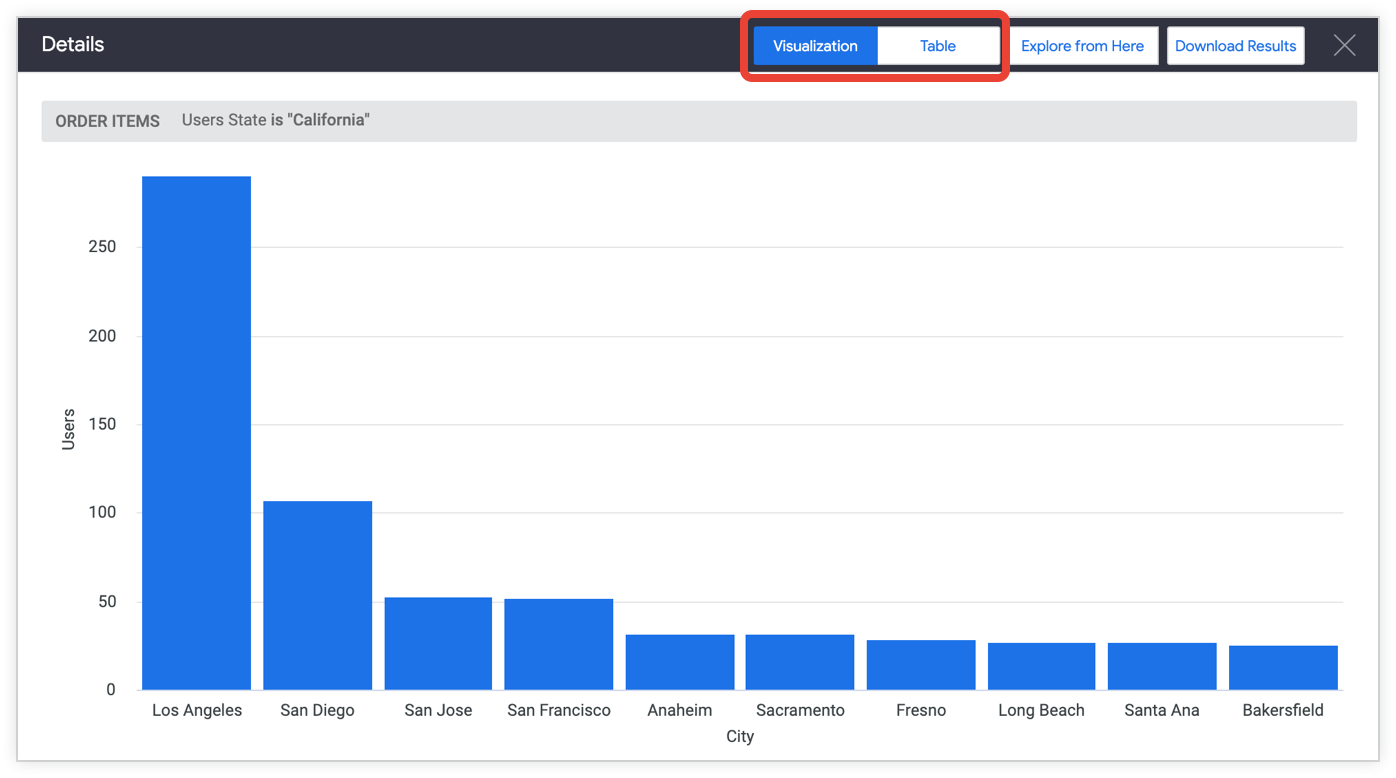
If your Looker admin has enabled the Visual Drilling Labs feature, drill visualizations will not always default to a data table. Instead, Looker will select the best visualization type to show for each drill. When the visualization from a drill is not a table, the Visualization and Table buttons at the top of the Details window let you switch between the default visualization type and a data table.
Drilling into a Look's visualization
Looker also lets you drill into a specific data value by selecting a data value from a Look's visualization. To do so, select the data point in the visualization about which you'd like more information.
You can choose a drill option from the drill menu when you select the value you're interested in.
For example, an Order count by month Look displays an area chart graphing the count of orders by month. Selecting an Orders Count data point on the area chart will provide drill options that specific group of orders.
The user selects the Orders Count value of 1,147 placed in the Created Date month of 2019-06 to drill into the orders placed that month. In this case, the user is provided options for exploring row-level data for all 1,147 orders placed, or they can choose to display drill results grouped by a different time granularity within that month based on the time frames that are available for the Created Date field.
The drill results are populated in the Details window, and you can select a column header to sort them by column. When you drill, you may also see an option to filter by the selected data point; in that case, you can choose to filter the visualization by that data point.
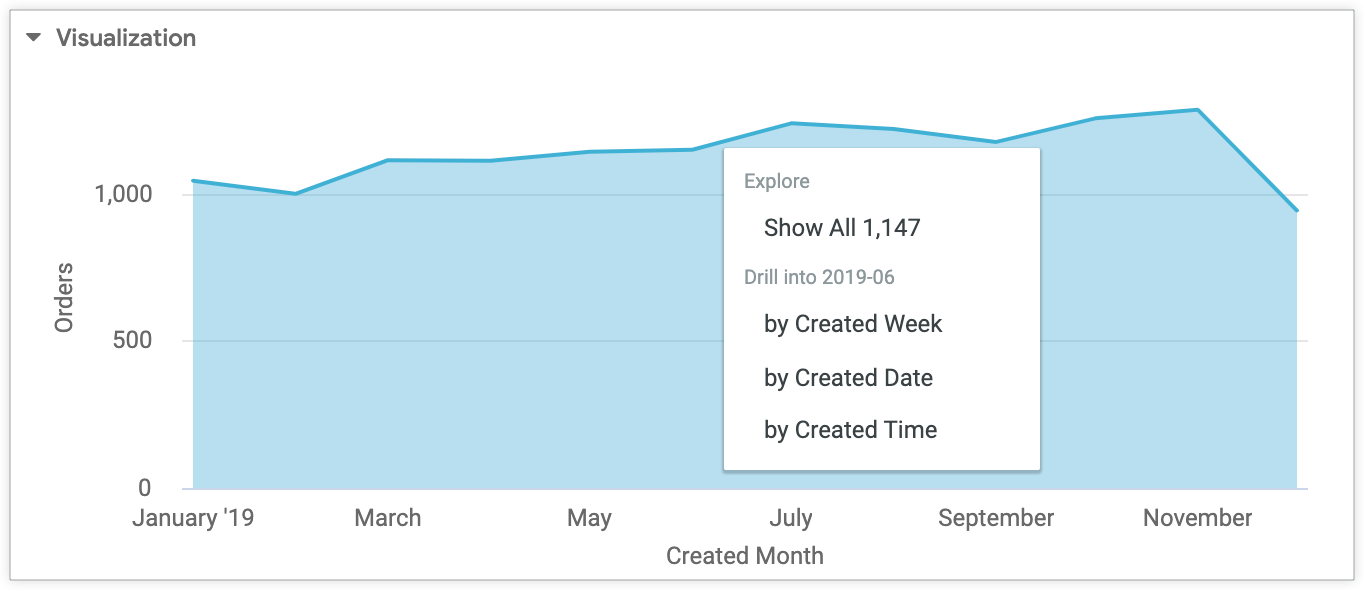
The options that appear to you will change depending on the data and visualization you're using.
Using links and actions
The presence of links or actions is indicated by an ellipsis (…) following the value in a column.
Using links
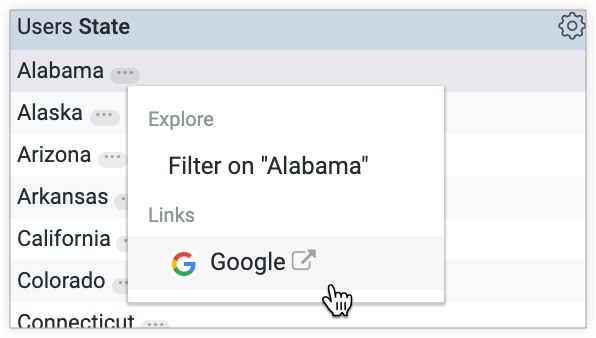
Your Looker developers may have added links to your data. The option to open the link will be available in the Links section of the drill menu when you select a value in a data table column.
For example, if a developer adds a Google search link to the State field, Looker will provide an option to perform a Google search for a state's name in the Links section of the drill menu when you select a state value from the State column in a data table.
Using actions
Your Looker developers may have added data actions to the dimensions or measures in your data. With data actions, you can perform tasks with other tools directly from Looker, such as sending an email or setting values in other applications. These data actions appear in the drill menu in the Actions section of the drill menu.
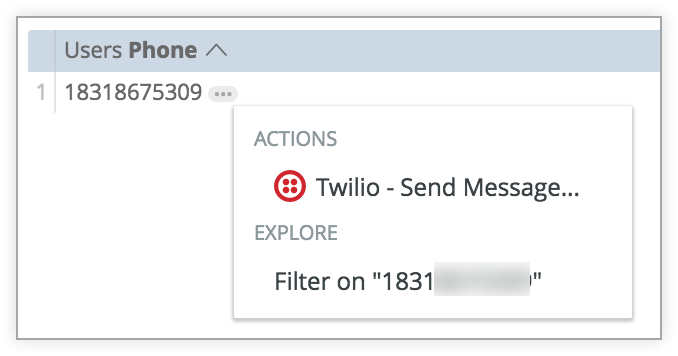
In the preceding example, the Phone field has a link to the Twilio service. When you select the phone number and choose the Twilio action, Twilio prompts you to enter a message. Twilio then sends that message to the phone number.
Zooming on Cartesian charts
You may be able to zoom on a Look's visualization that contains a Cartesian chart (a column, a bar, a scatterplot, a line, an area, a waterfall, or a boxplot chart). This can be helpful when a chart displays a large volume of densely packed data points that may be difficult to read individually.
To zoom, click and drag to highlight an area within the visualization that you want to zoom on.
For example, in the following densely packed scatterplot chart displaying a large amount of average high temperature values for US national parks, the shaded rectangle is the area that will be zoomed on:
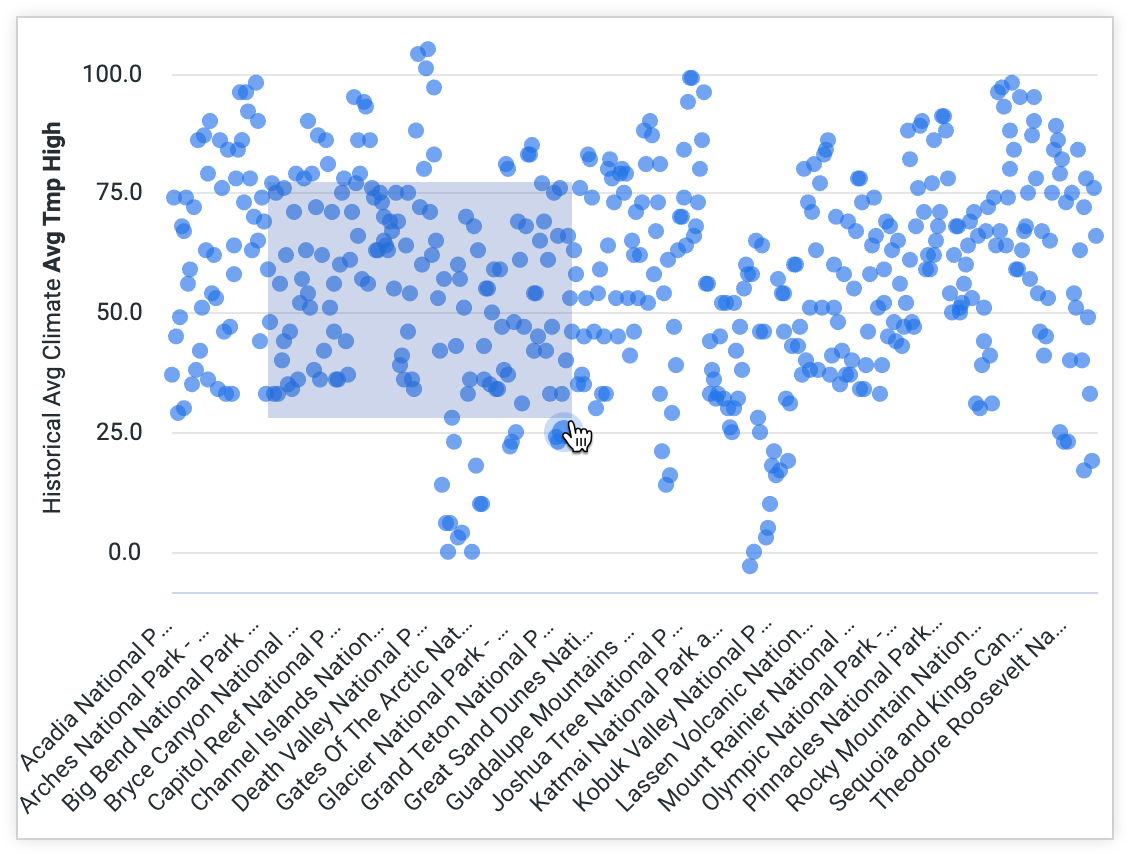
After you highlight the area, the visualization refreshes with the zoom area expanded to the full visualization size. While zoomed in, you can pan the zoomed area horizontally by holding down the Shift key and dragging the visualization right or left.
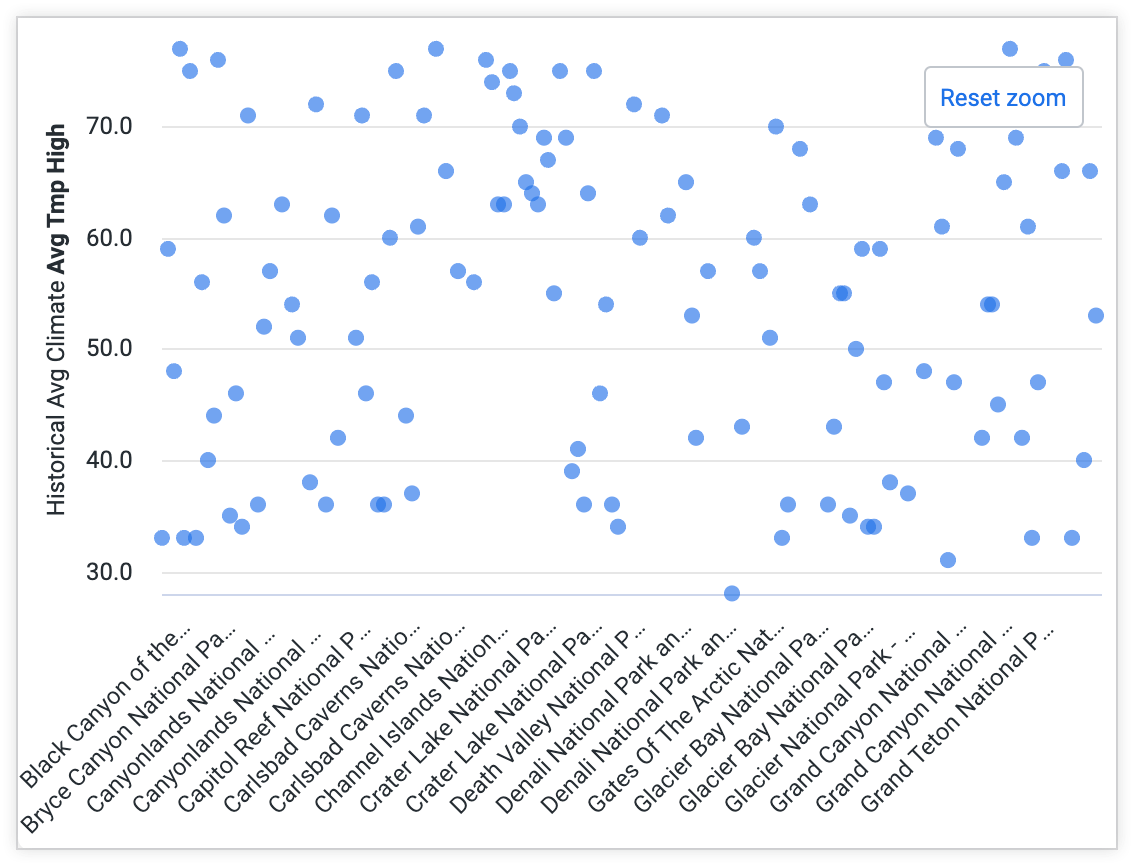
A Reset zoom button appears near the top right of the visualization; select the button to reset the visualization to its original appearance. Zoom areas cannot be saved and will be reset when the viewer closes the Look or navigates away from it.
If a visualization has the Allow Zoom option disabled for the Y menu, you cannot zoom into smaller portions of the y-axis; you can zoom only into smaller portions of the x-axis. When you highlight an area to zoom, the entire y-axis will be included as shown in the following visualization:
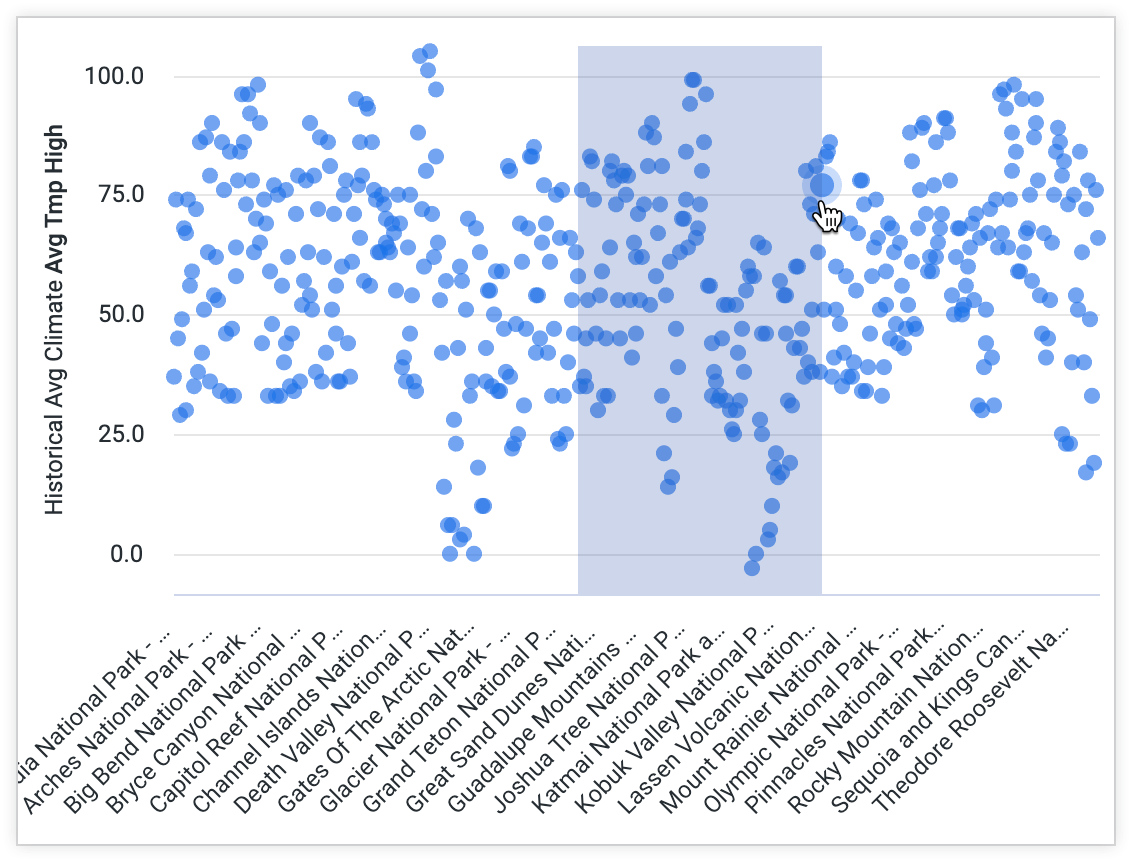
If a visualization has the Allow Zoom option on the X menu disabled, you cannot zoom on the visualization at all.
Navigation shortcuts
When exploring a Look, you can navigate to other items saved within the same folder. To quickly navigate to saved content within the same folder:

Select the folder name displayed within the Look.

Select an option displayed in the drop-down menu. You can choose to navigate to the Look's folder, or to any dashboards or Looks that are saved in the same folder.
Viewing visualizations on mobile devices
When viewing a Look visualization on a mobile device, Looker has the following touch options to make it easier to view information about your data:
- Tap a data point on the visualization to show information about that data point.
- Press and hold a data point to drill into the data behind the data point.
- Press and drag across the visualization to show information about each data point as you move over them.
Conclusion
You now know how to view and understand existing Looks. If you'd like to learn how to create your own queries, check out our Exploring data in Looker documentation page.
