本文件說明如何使用「記錄資訊主頁」頁面,透過預先定義的資訊主頁或自訂資訊主頁,偵測系統行為趨勢、監控工作負載,以及診斷及解決問題。
資訊主頁類型
「Logs Dashboard」頁面提供兩種選項,可用來視覺化 Google Cloud 專案中資源的成效:預先定義的資訊主頁和自訂資訊主頁。預先定義的資訊主頁一律可供使用,並由 Monitoring 管理,但您也可以自訂這個預先定義的資訊主頁。
預先定義的資訊主頁
系統會自動設定預先定義的資訊主頁,且只提供 Google Cloud 專案中產生記錄資料的資源資訊。
預先定義的資訊主頁會針對下列每個資源類型,整理成一組對應的圖表:
Google Kubernetes Engine
Compute Engine
App Engine
Cloud Load Balancing
Cloud SQL
BigQuery
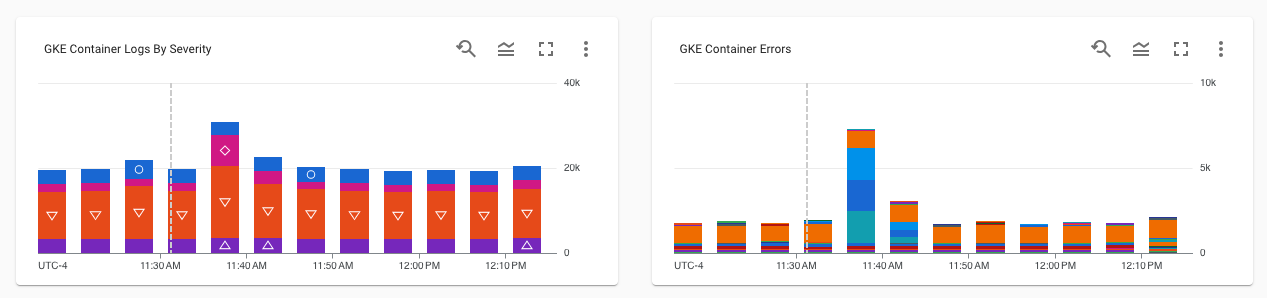
一張圖表會顯示記錄數量和嚴重性類型,例如 WARNING。另一個圖表會顯示含有錯誤的記錄。如要進一步瞭解嚴重性類型或錯誤記錄,請將滑鼠游標懸停在圖表上。
下圖為預先定義資訊主頁的範例:
自訂資訊主頁
如果預先定義的資訊主頁內容不含您需要的疑難排解資訊,建議您建立自訂資訊主頁。自訂資訊主頁可讓您顯示感興趣的資訊,並以對您有用的格式進行整理。舉例來說,您可以建立資訊主頁,顯示實際工作環境中虛擬機器 (VM) 的記錄、指標和快訊政策。
自訂資訊主頁由 Cloud Monitoring 管理,但您必須建立新的自訂資訊主頁,才能在「Logs Dashboard」頁面中使用。您在「Logs Dashboard」頁面中建立的自訂資訊主頁,只能在 Cloud Logging 中存取。建立自訂資訊主頁時,系統會將預先定義的資訊主頁複製到自訂資訊主頁,方便您刪除不必要的小工具,並新增缺少的內容。
查看預先定義的資訊主頁
如要查看預先定義的資訊主頁,請按照下列步驟操作:
-
在 Google Cloud 控制台中,前往「Logs Dashboard」頁面:
如果您是使用搜尋列尋找這個頁面,請選取子標題為「Monitoring」的結果。
如果已啟用「資訊主頁」選單,請選取「預先定義」。
自訂預先定義的資訊主頁
您無法修改預先定義的資訊主頁。不過,您可以複製這個資訊主頁,然後修改副本。
如要建立預先定義資訊主頁的副本,請按照下列步驟操作:
-
在 Google Cloud 控制台中,前往「Logs Dashboard」頁面:
如果您是使用搜尋列尋找這個頁面,請選取子標題為「Monitoring」的結果。
- 在資訊主頁的工具列中,選取 edit「自訂資訊主頁」。
系統會建立並顯示資訊主頁。資訊主頁名稱會列在「自訂檢視畫面名稱」文字方塊中。工具列也會顯示三個按鈕:新增小工具、退出編輯模式和「儲存」。
新增或移除小工具、編輯現有小工具或移動小工具,即可修改資訊主頁。
舉例來說,如要新增小工具,請按一下「Add widget」(新增小工具),完成對話方塊,然後選取「Apply」(套用)。如要進一步瞭解如何新增小工具,請參閱下列頁面:
完成修改後,請前往工具列並按一下「儲存」。
如要切換預先定義的資訊主頁和自訂資訊主頁,請使用工具列中的選單。
後續步驟
如要瞭解資訊主頁和如何選取資訊主頁的顯示資訊,請參閱「資訊主頁總覽」。
如要進一步瞭解如何在資訊主頁上顯示專案範圍的記錄,請參閱「在自訂資訊主頁上顯示記錄」一文。