Questo documento descrive come elencare e rappresentare graficamente le metriche basate su log utilizzando la consoleGoogle Cloud . Per informazioni sulla creazione di metriche basate su log, consulta Configurare le metriche di conteggio e Configurare le metriche di distribuzione.
Prima di iniziare
Assicurati che il tuo ruolo Identity and Access Management includa le autorizzazioni necessarie per creare e visualizzare metriche basate su log e per creare policy di avviso. Per maggiori dettagli, vedi Autorizzazioni per le metriche basate su log.
Elenca le metriche basate su log
Per visualizzare un elenco di metriche basate su log per il tuo progetto Google Cloud , segui questi passaggi:
-
Nella console Google Cloud , vai alla pagina Metriche basate su log:
Se utilizzi la barra di ricerca per trovare questa pagina, seleziona il risultato con il sottotitolo Logging.
Seleziona un progetto Google Cloud esistente. L'interfaccia delle metriche basate su log mostra due elenchi di tipi di metriche: Metriche di sistema e Metriche definite dall'utente.
Il riquadro Metriche definite dall'utente dell'interfaccia delle metriche basate su log offre diverse funzionalità per aiutarti a gestire le metriche definite dall'utente nel tuoGoogle Cloud progetto:
La tabella delle metriche definite dall'utente include le colonne Nome, Descrizione, Tipo e Filtro. Questi campi vengono specificati quando crei la metrica.
Il riquadro Filtra metriche definite dall'utente ti consente di filtrare l'elenco delle metriche in base alla ricerca di testo o a Nome, Descrizione e Filtro della metrica.
La tabella delle metriche definite dall'utente include colonne per Utilizzo del mese precedente e Utilizzo da inizio mese. Questi dati sull'utilizzo sono utili, ad esempio, se vuoi determinare quali metriche acquisiscono più dati o per stimare le tue fatture.
Il menu more_vert Altro per ogni metrica nel riquadro delle metriche definite dall'utente contiene funzionalità aggiuntive per la gestione delle metriche:
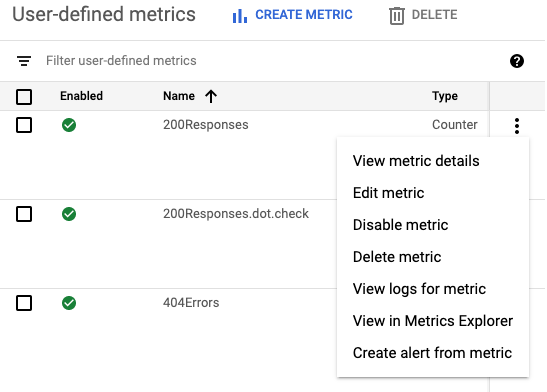
- Visualizza dettagli metrica: mostra Nome, Tipo, Descrizione, Filtro, Unità ed Etichette della metrica, se definiti.
- Modifica metrica: ti consente di modificare determinati campi della metrica.
- Disabilita metrica: impedisce il calcolo della metrica. Puoi riattivare una metrica disattivata dallo stesso menu.
- Elimina metrica: consente di eliminare la metrica.
- Visualizza log per metrica: ti reindirizza a Esplora log e compila il filtro della metrica nel generatore di query ed esegue la query.
- Visualizza in Esplora metriche: consente di tracciare un grafico della metrica.
- Crea avviso da metrica: consente di configurare le notifiche quando una metrica basata sui log corrisponde ai criteri specificati. Per ulteriori informazioni, consulta Avvisi sulle metriche basate su log.
Grafico delle metriche basate su log
Per creare un grafico di una metrica basata su log:
-
Nella console Google Cloud , vai alla pagina Metriche basate su log:
Se utilizzi la barra di ricerca per trovare questa pagina, seleziona il risultato con il sottotitolo Logging.
Individua la metrica che vuoi visualizzare, quindi seleziona Visualizza in Esplora metriche dal menu more_vert Altro della metrica.
Si apre Esplora metriche, che è preconfigurato per te. Tuttavia, potresti voler modificare alcune impostazioni del grafico.
Ad esempio, lo screenshot seguente mostra un grafico della metrica di sistema con il nome
byte_countper un progetto Google Cloud specifico: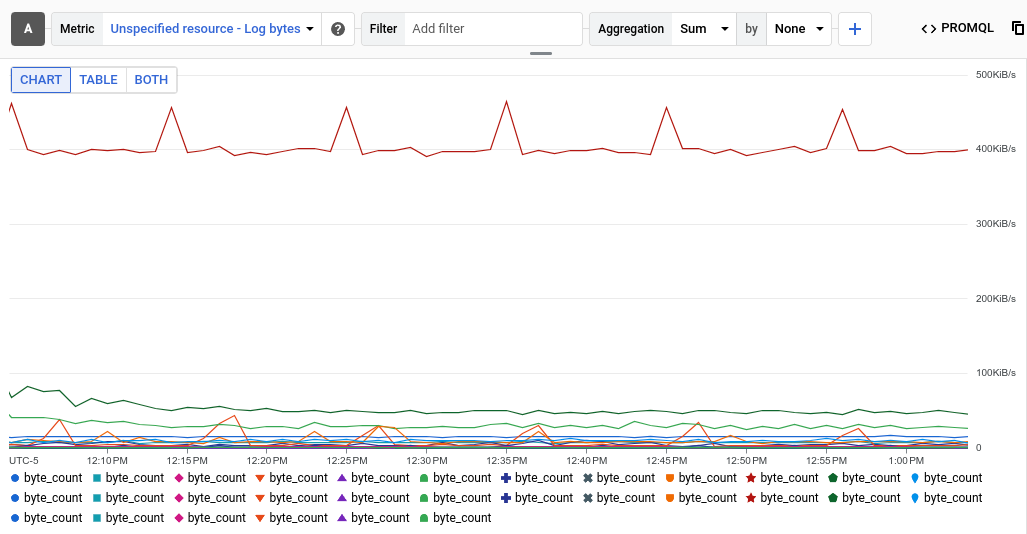
La voce Aggregazione mostra che ogni serie temporale nel grafico è una somma dei byte scritti in un log specifico. Nell'esempio precedente, il progetto contiene più log, quindi il grafico mostra più serie temporali.
Per visualizzare i dati di un log specifico, aggiungi un filtro. Ad esempio, per visualizzare la metrica
byte_countper le voci di log scritte da BigQuery, fai clic su Aggiungi filtro, seleziona log e poi seleziona la voce BigQuery. Il grafico ora mostra una singola serie temporale, che indica il totale dei byte di log scritti da BigQuery. Se vuoi visualizzare la metricabyte_countin base alla gravità della voce di log, modifica il secondo menu nella voce Aggregazione da Nessuna a Gravità. Il seguente grafico mostra la metricabyte_countvisualizzata in base al livello di gravità per i log scritti da BigQuery: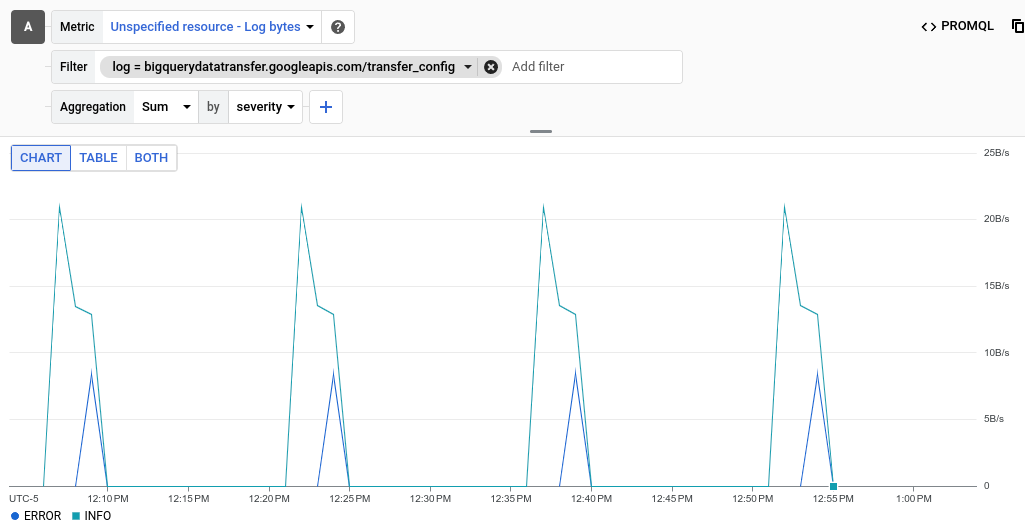
Per le metriche basate sui log con valori di distribuzione, espandi Grafico a linee e seleziona Grafico a mappa termica.
Per ulteriori informazioni sulle metriche con valori di distribuzione, vedi Metriche di distribuzione e Percentili e metriche con valori di distribuzione.
(Facoltativo) Per salvare il grafico per riferimento futuro, fai clic su Salva grafico nella barra degli strumenti, quindi completa la finestra di dialogo. Puoi salvare il grafico in una dashboard esistente o crearne una nuova.
Passaggi successivi
- Per creare un criterio di avviso per una metrica basata su log, consulta Avvisi sulle metriche basate su log.
Per saperne di più sulla creazione di grafici dei dati delle metriche, consulta queste risorse di monitoraggio: