Mantieni tutto organizzato con le raccolte
Salva e classifica i contenuti in base alle tue preferenze.
Questo documento descrive come trovare, filtrare ed escludere le voci di log che fanno parte di gruppi di errori quando utilizzi Esplora log.
I gruppi di errori
ti aiutano a identificare tendenze e problemi ricorrenti nel tuo ambiente raggruppando
le voci di log che contengono errori in base a valori quali
tipo di eccezione, frame o messaggi.
Trovare i dettagli del gruppo di errori per una voce di log
Per monitorare gli errori ricorrenti nell'applicazione e gestire il loro stato di risoluzione, utilizza la pagina Error Reporting della console Google Cloud .
La pagina Error Reporting elenca i gruppi di errori, incluse
informazioni sul tipo specifico di errore, il numero di occorrenze di errore
e lo stato di risoluzione di ogni gruppo.
Error Reporting imposta automaticamente il valore del campo ID error_groups durante la creazione di un gruppo di errori. Il campo
contiene caratteri alfanumerici, - e _.
Per eseguire una query per un gruppo di errori specifico:
Nella console Google Cloud , vai alla pagina Error Reporting:
Se utilizzi la barra di ricerca per trovare questa pagina, seleziona il risultato con il sottotitolo
Logging.
Per visualizzare le voci di log associate a un gruppo di errori, inserisci il seguente filtro nel campo dell'editor di query:
errorGroups.id:*
Nel riquadro Risultati delle query, seleziona una voce di log che mostri il pulsante
Gruppo di errori.
Fai clic sul pulsante Gruppo di errori e
seleziona Visualizza dettagli gruppo di errori:
Ad esempio, lo screenshot seguente mostra due voci di log con un
livello di gravità di almeno errore.
Una di queste voci è annotata con il pulsante Gruppo di errori. Anche lo screenshot seguente illustra le
opzioni disponibili con questo pulsante:
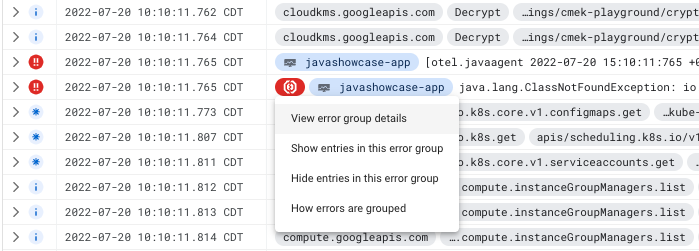
Dopo aver selezionato Visualizza dettagli gruppo di errori, si apre la pagina Report errori
che mostra informazioni sul gruppo di errori.
Puoi anche utilizzare le opzioni del pulsante Gruppo di errori per modificare le voci di log visualizzate da Explorer log:
Per esaminare il gruppo di errori in modo più dettagliato, seleziona
Mostra voci in questo gruppo di errori. Esplora log viene aggiornato e
mostra solo le voci di log nello stesso gruppo di errori. Ora puoi applicare
parametri di ricercay aggiuntivi alle voci di log del gruppo di errori.
Per rimuovere un gruppo di errori specifico dai risultati della query,
seleziona Nascondi voci in questo gruppo di errori. Esplora log viene aggiornato
e tutte le voci di log in questo gruppo di errori vengono nascoste dalla visualizzazione.
Monitorare i gruppi di errori
Puoi configurare Error Reporting in modo che ti invii una notifica quando rileva un nuovo gruppo di errori. Questo servizio consente anche di visualizzare la cronologia degli errori per ogni gruppo di errori e di gestirli. Per ulteriori informazioni, consulta i seguenti documenti:
Non puoi creare metriche basate su log che conteggiano il numero di voci di log con gruppi di errori né configurare un avviso basato su log per ricevere una notifica quando una voce di log contiene un gruppo di errori. Analogamente, non puoi estrarre valori dal campo
errorGroups in un'etichetta collegata a una metrica basata sui log o
a un avviso basato sui log.
[[["Facile da capire","easyToUnderstand","thumb-up"],["Il problema è stato risolto","solvedMyProblem","thumb-up"],["Altra","otherUp","thumb-up"]],[["Difficile da capire","hardToUnderstand","thumb-down"],["Informazioni o codice di esempio errati","incorrectInformationOrSampleCode","thumb-down"],["Mancano le informazioni o gli esempi di cui ho bisogno","missingTheInformationSamplesINeed","thumb-down"],["Problema di traduzione","translationIssue","thumb-down"],["Altra","otherDown","thumb-down"]],["Ultimo aggiornamento 2025-09-05 UTC."],[],[],null,["# Find log entries with error groups\n\nThis document describes how to find, filter, and exclude log entries that are\npart of error groups when using the Logs Explorer.\n[Error groups](/error-reporting/docs/grouping-errors)\nhelp you identify trends and recurring problems in your environment by grouping\nlog entries that have errors by values such\nas exception type, frames, or messages.\n\nFind error group details for a log entry\n----------------------------------------\n\nTo track recurring errors across your application and to manage their resolution\nstatus, use the **Error Reporting** page of the Google Cloud console.\nThe **Error Reporting** page lists error groups, including\ninformation about the specific type of error, the number of error occurrences,\nand the resolution status of each group.\n\nError Reporting automatically sets the value of the\n`error_groups` ID field during the creation of an error group. The field\ncontains alphanumeric characters, `-` and `_`.\n\nTo query for a specific error group, do the following:\n\n1. In the Google Cloud console, go to the **Error Reporting** page:\n\n [Go to **Error Reporting**](https://console.cloud.google.com/errors)\n\n \u003cbr /\u003e\n\n You can also find this page by using the search bar.\n2. Click the error name.\n3. In the **Recent samples** panel, click **View Logs** from any log entry to redirect you to the **Logs Explorer** page.\n4. In the **Logs Explorer** , the query-editor field is populated with the\n `error_groups` ID field. For example, `errorGroups.id=\"CJqhkd7Qvsbj2QE\"`.\n\n The list of log entries contributing to that error group is shown in the\n **Query results** pane.\n\nTo query for log entries that belong to any error group and to find the error\ngroup details, do the following:\n\n1. In the Google Cloud console, go to the **Logs Explorer** page:\n\n [Go to **Logs Explorer**](https://console.cloud.google.com/logs/query)\n\n \u003cbr /\u003e\n\n If you use the search bar to find this page, then select the result whose subheading is\n **Logging**.\n2. To view log entries associated with any error group, enter the following\n filter into the query-editor field:\n\n errorGroups.id:*\n\n3. In the **Query results** pane, select a log entry that displays the\n **Error group** button.\n\n4. Click the **Error group** button and\n select **View error group details**:\n\n For example, the following screenshot shows two log entries with a\n severity level of at least error.\n One of these entries is annotated with the\n **Error group** button. The following screenshot also illustrates the\n options available with this button:\n\n After you select **View error group details** , the **Error reporting**\n page opens and displays information about the error group.\n\nYou can also use the options in the\n**Error group** button to change which log entries the Logs Explorer\ndisplays:\n\n- To investigate the error group in more detail, select\n **Show entries in this error group**. Logs Explorer is refreshed and\n displays only those log entries in the same error group. You can now apply\n additional query parameters to the error group's log entries.\n\n- To remove a specific error group from your query results,\n select **Hide entries in this error group**. Logs Explorer is refreshed\n and all log entries in this error group are hidden from the display.\n\nMonitor error groups\n--------------------\n\nYou can configure Error Reporting to notify you when it detects a\nnew error group. This service also lets you view the history of errors for\neach error group and to manage those errors. For more information,\nsee the following documents:\n\n- [Configure and manage notifications](/error-reporting/docs/notifications)\n- [View and filter errors](/error-reporting/docs/viewing-errors)\n\nYou can't create log-based metrics that count the number of log entries with\nerror groups or configure a log-based alert to notify you when a log entry\ncontains an error group. Similarly, you can't extract values from the\n`errorGroups` field into a label attached to a log-based metric or\nlog-based alert."]]