使用 Cloud DNS 監控資訊主頁
本頁面說明 Cloud DNS 的預先定義監控資訊主頁(不公開區域)。
如要存取資訊主頁,請前往 Google Cloud 控制台的「Dashboards」(資訊主頁) 頁面。
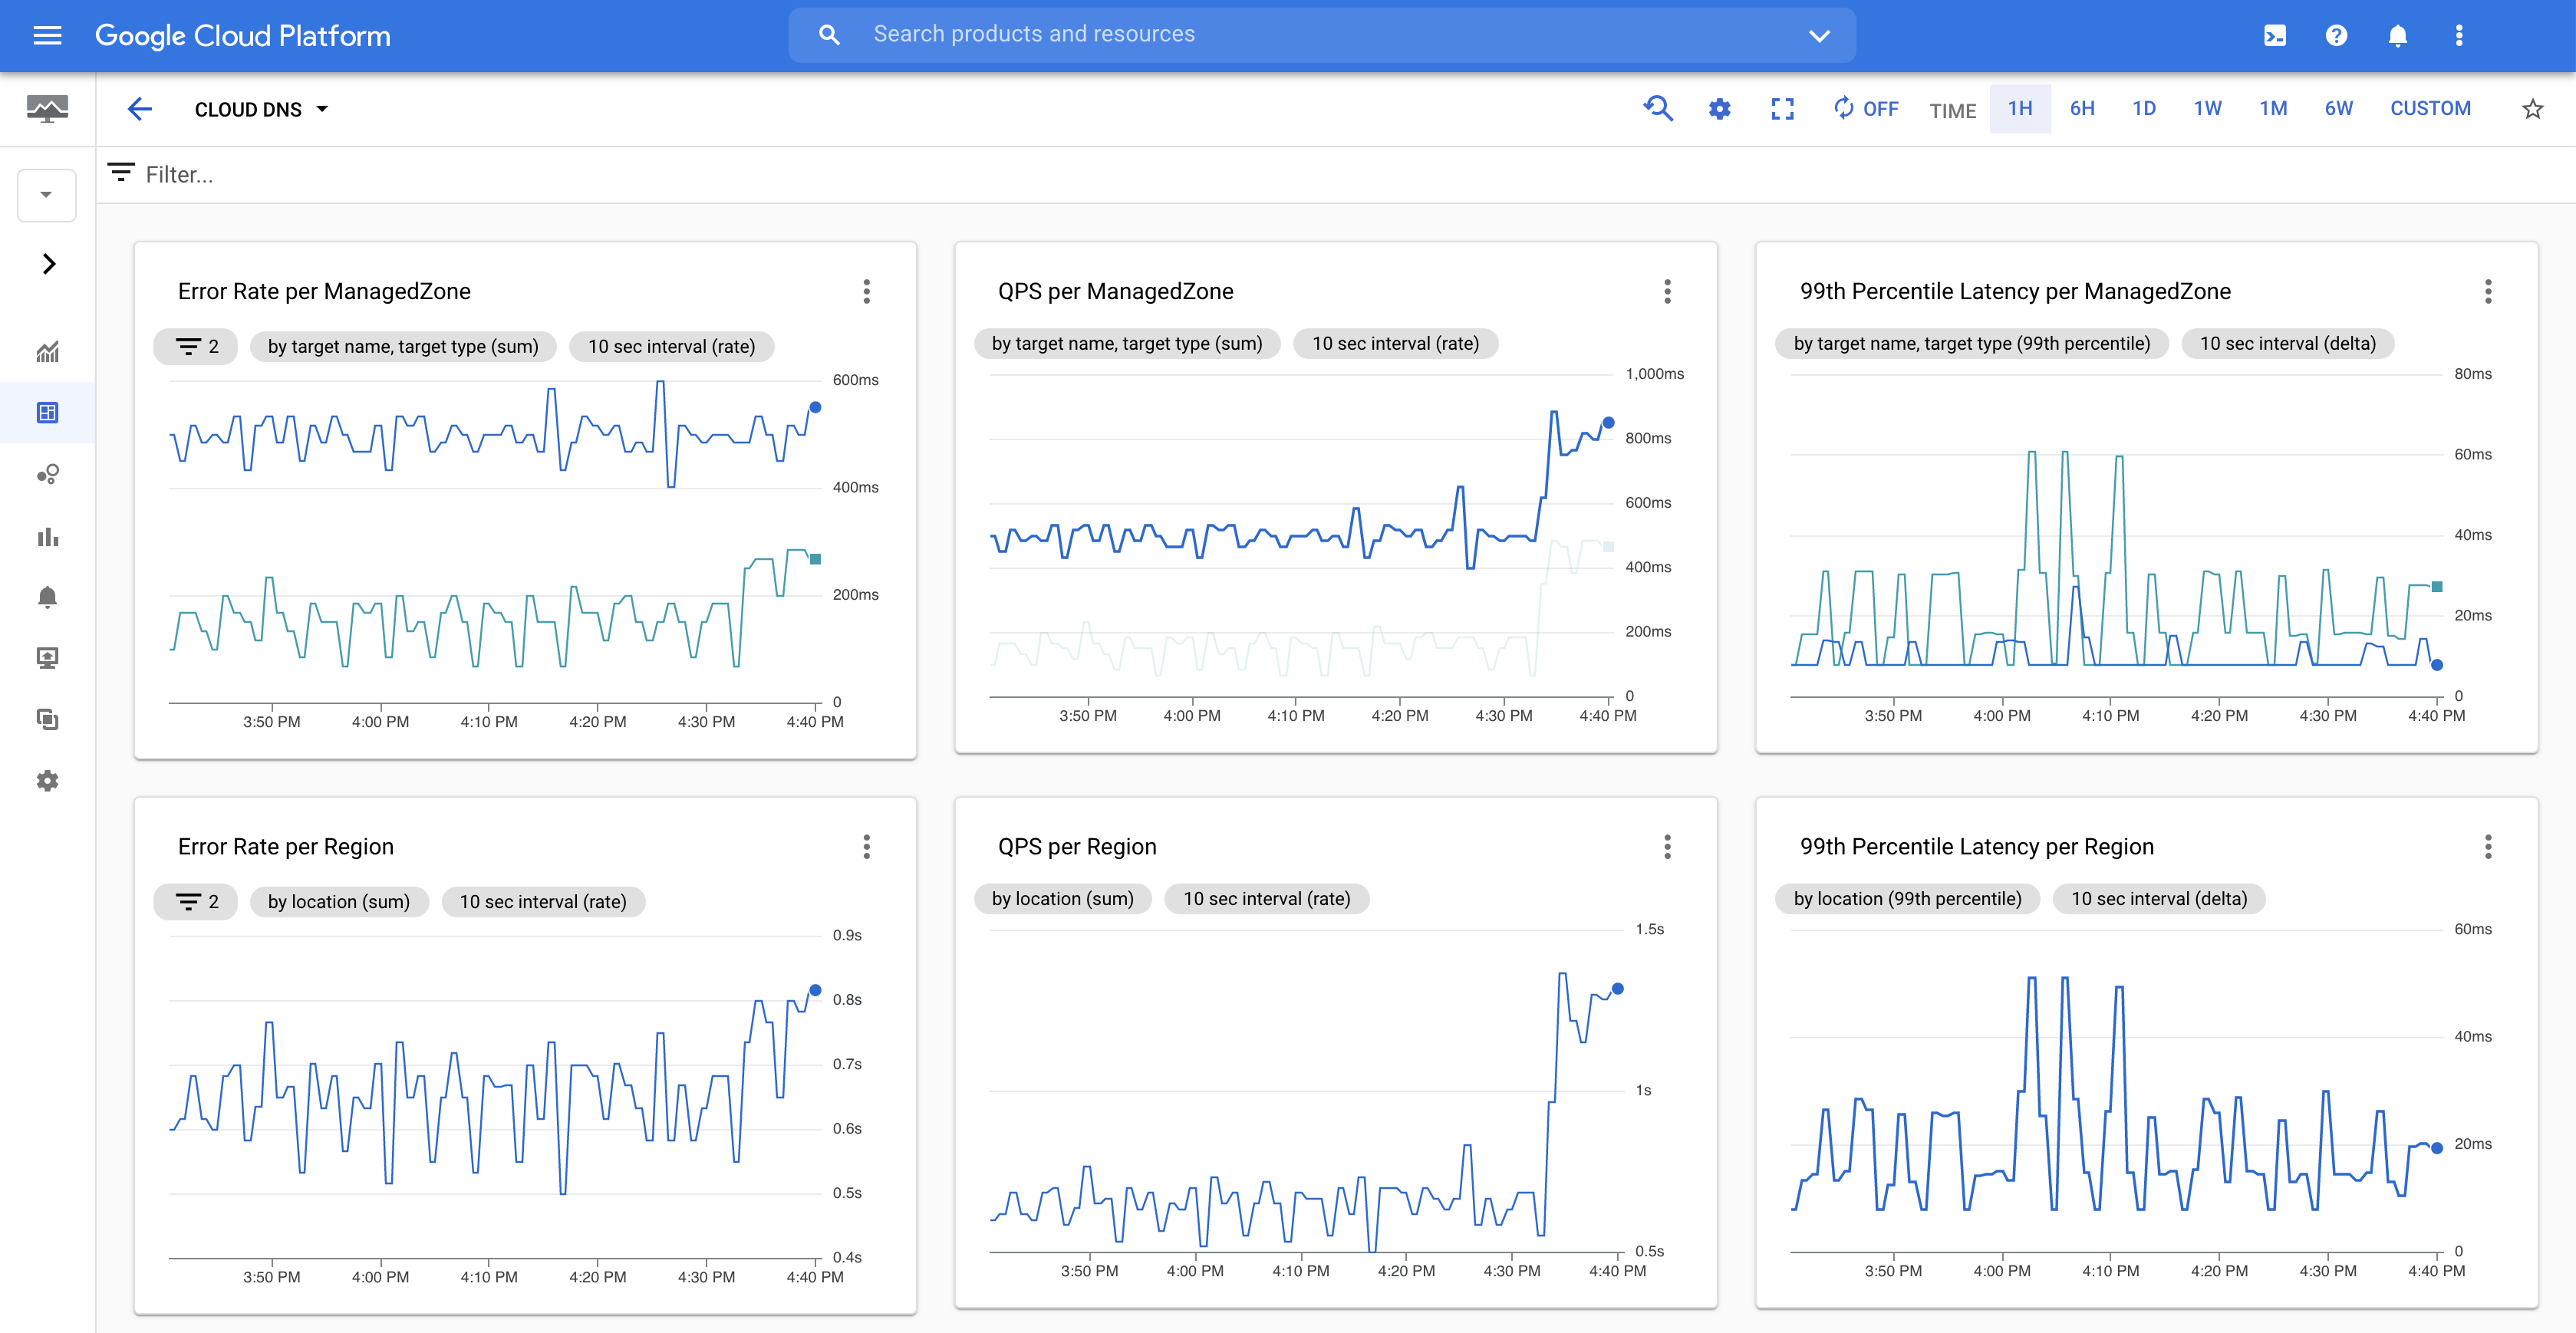 Cloud DNS 監控資訊主頁 (按一下可放大)。
Cloud DNS 監控資訊主頁會顯示 DNS 查詢的圖表,以及錯誤率、每秒查詢次數和第 99 個百分位數延遲時間的資料。
監控頁面可讓您選擇資料的顯示方式。
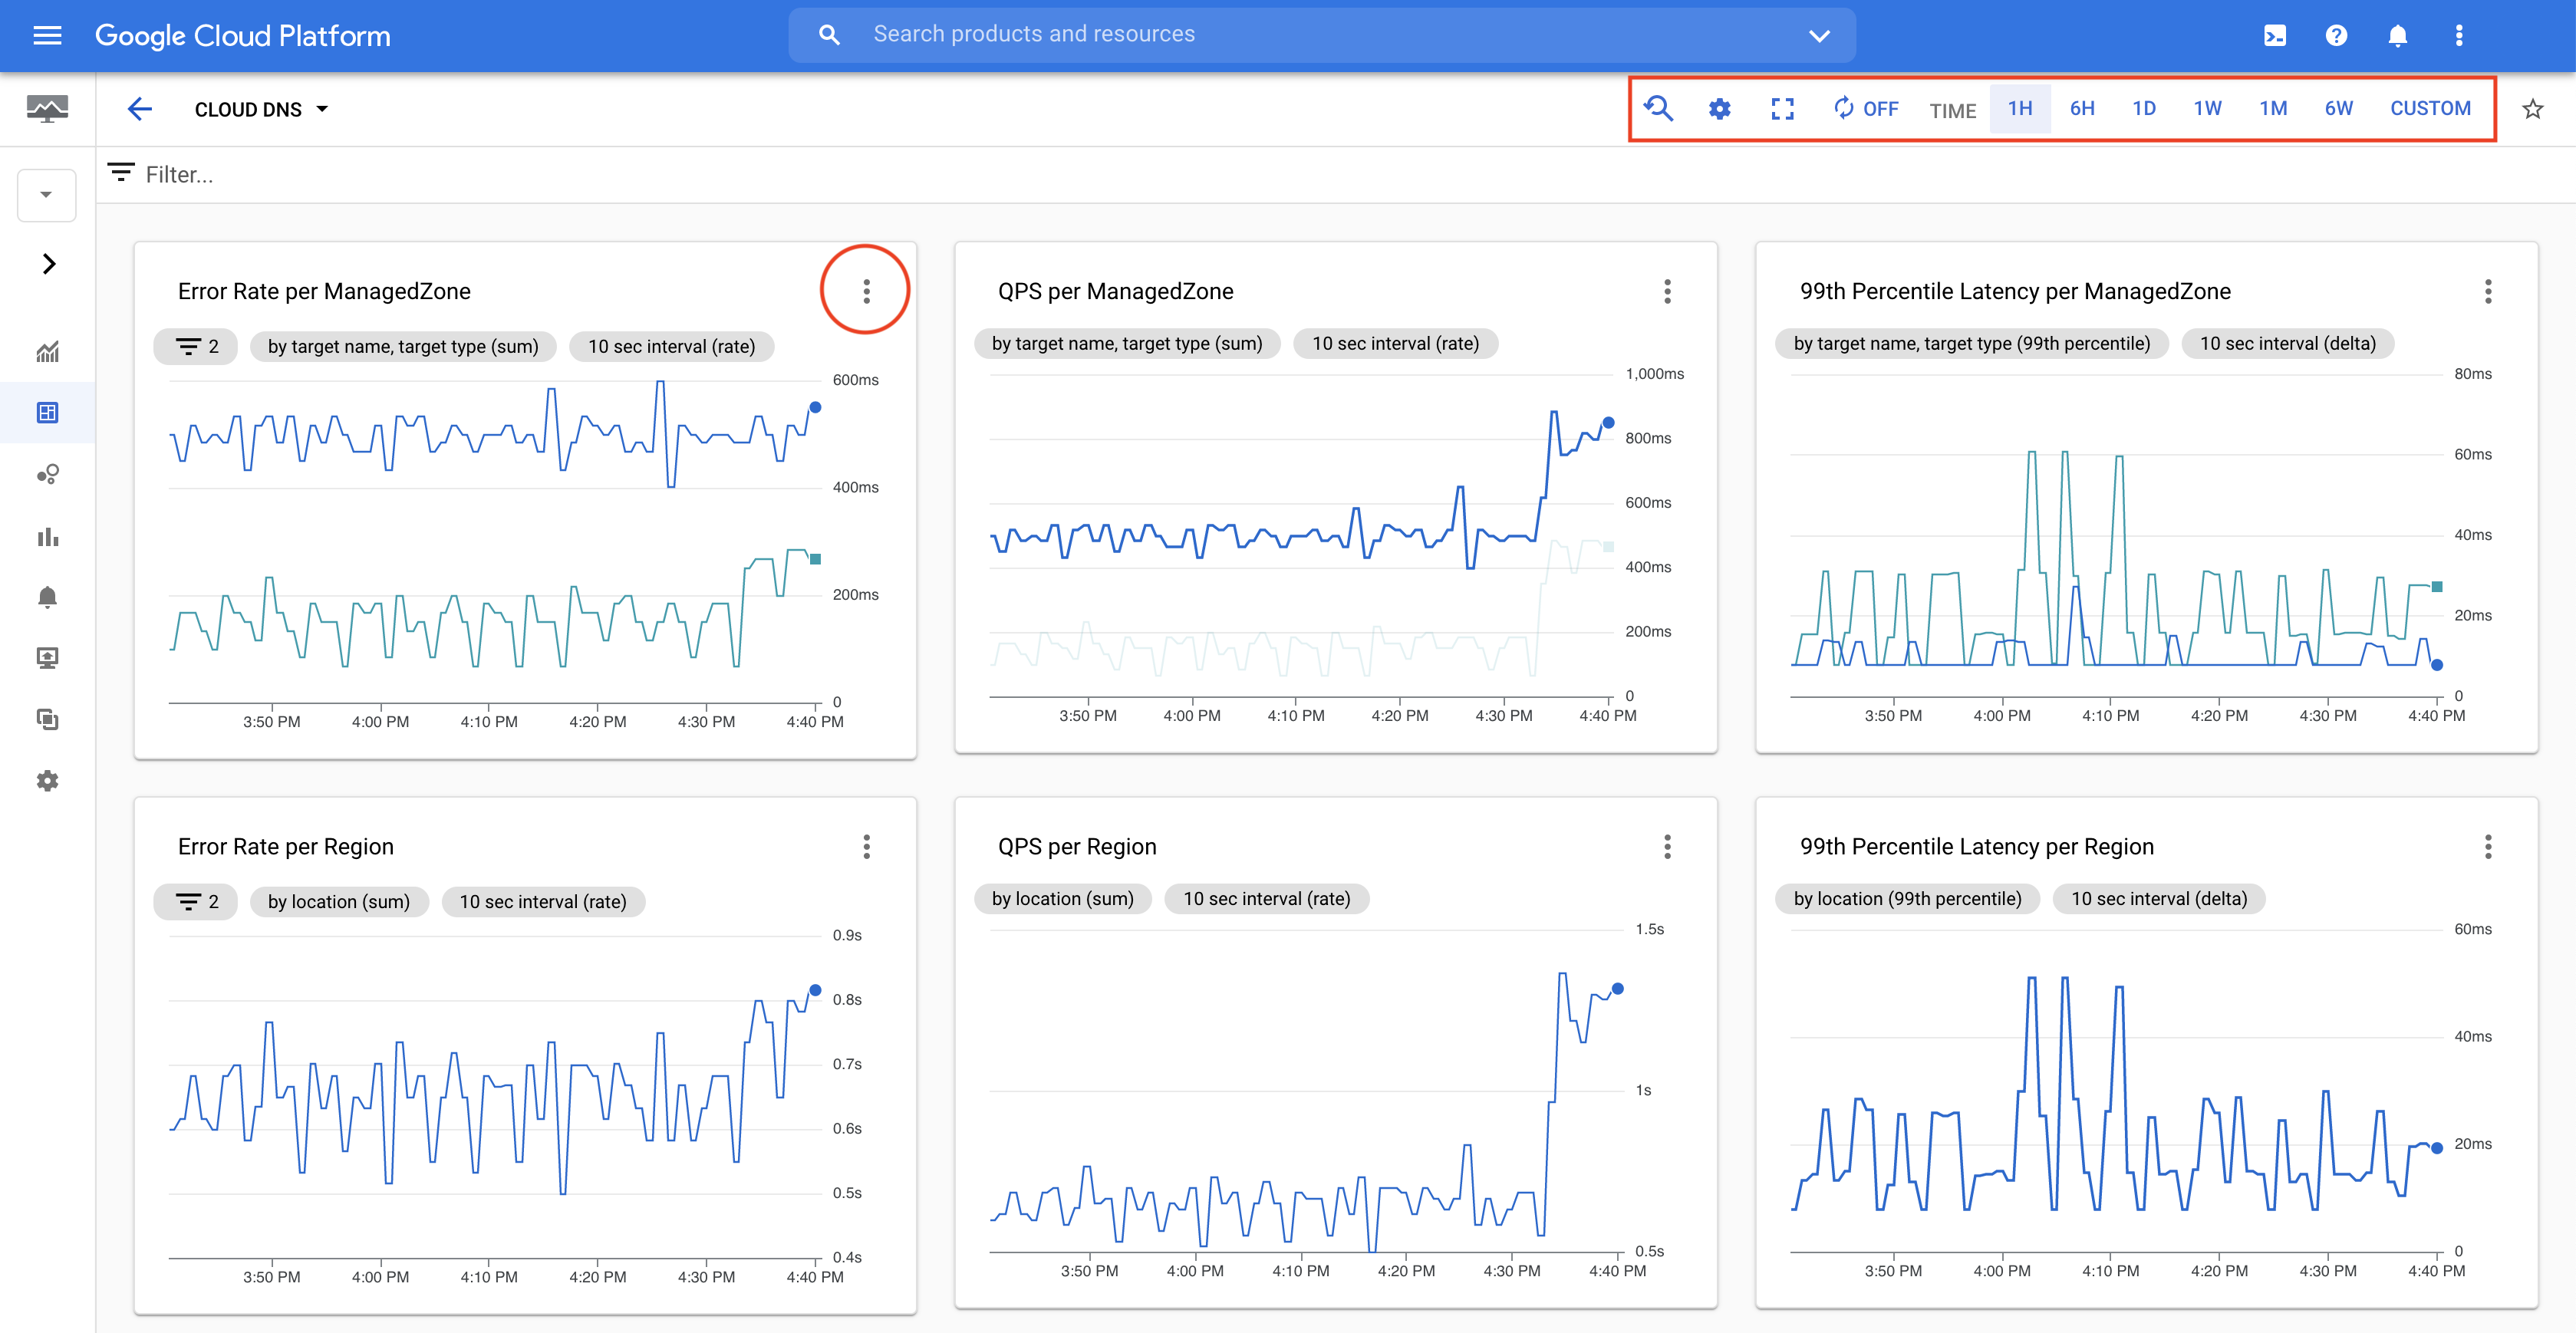 Google Cloud 控制台監控頁面 (按一下即可放大)。
如要執行下列操作 (及其他操作),請按一下個別圖表右上方的「選單」圖示 more_vert:
- 在 Metrics Explorer 中查看。您可以在 Metrics Explorer 中開啟圖表,視需要編輯輸入參數並試用資料。這不會變更實際資訊主頁中的圖表內容。
- 展開圖表圖例。方便您查看圖例,瞭解圖表上每條線的意義。
- 查看統計資料模式。這樣一來,您就能查看更多顯示資料額外統計資料的折線圖。舉例來說,在第 99 百分位數延遲圖表中,也會顯示平均值、中位數和第 5 百分位數。
在頁面右上角的選單中,您可以調整圖表的時標。
除非另有註明,否則本頁面中的內容是採用創用 CC 姓名標示 4.0 授權,程式碼範例則為阿帕契 2.0 授權。詳情請參閱《Google Developers 網站政策》。Java 是 Oracle 和/或其關聯企業的註冊商標。
上次更新時間:2025-10-19 (世界標準時間)。
[[["容易理解","easyToUnderstand","thumb-up"],["確實解決了我的問題","solvedMyProblem","thumb-up"],["其他","otherUp","thumb-up"]],[["難以理解","hardToUnderstand","thumb-down"],["資訊或程式碼範例有誤","incorrectInformationOrSampleCode","thumb-down"],["缺少我需要的資訊/範例","missingTheInformationSamplesINeed","thumb-down"],["翻譯問題","translationIssue","thumb-down"],["其他","otherDown","thumb-down"]],["上次更新時間:2025-10-19 (世界標準時間)。"],[],[]]