Cloud Composer 3 | Cloud Composer 2 | Cloud Composer 1
This page describes how to monitor the overall Cloud Composer environment health and performance with key metrics in the Monitoring dashboard.
Introduction
This tutorial focuses on the key Cloud Composer monitoring metrics that can provide a good overview of environment-level health and performance.
Cloud Composer offers multiple metrics that describe the overall state of the environment. The monitoring guidelines in this tutorial are based on the metrics exposed on the Monitoring dashboard of your Cloud Composer environment.
In this tutorial, you will learn about the key metrics that serve as the primary indicators of issues with your environment's performance and health, as well as the guidelines for interpreting each metric into corrective actions to keep the environment healthy. You will also set up alerting rules for each metric, run the example DAG, and use these metrics and alerts to optimize the performance of your environment.
Objectives
Costs
This tutorial uses the following billable components of Google Cloud:
When you finish this tutorial, you can avoid continued billing by deleting the resources you created. For more details, see Clean up.
Before you begin
This section describes actions that are required before you start the tutorial.
Create and configure a project
For this tutorial, you need a Google Cloud project. Configure the project in the following way:
In the Google Cloud console, select or create a project:
Make sure that billing is enabled for your project. Learn how to check if billing is enabled on a project.
Make sure that your Google Cloud project user has the following roles to create the necessary resources:
- Environment and Storage Object Administrator
(
roles/composer.environmentAndStorageObjectAdmin) - Compute Admin (
roles/compute.admin) - Monitoring Editor (
roles/monitoring.editor)
- Environment and Storage Object Administrator
(
Enable APIs for your project
Enable the Cloud Composer API.
Roles required to enable APIs
To enable APIs, you need the Service Usage Admin IAM
role (roles/serviceusage.serviceUsageAdmin), which
contains the serviceusage.services.enable permission. Learn how to grant
roles.
Create your Cloud Composer environment
Create a Cloud Composer 2 environment.
As a part of this procedure,
you grant the Cloud Composer v2 API Service Agent Extension
(roles/composer.ServiceAgentV2Ext) role to the Composer Service Agent
account. Cloud Composer uses this account to perform operations
in your Google Cloud project.
Explore key metrics for environment-level health and performance
This tutorial focuses on the key metrics that can give you a good overview of your environment's overall health and performance.
The Monitoring dashboard in Google Cloud console contains a variety of metrics and charts that allow for monitoring trends in your environment and identifying issues with Airflow components and Cloud Composer resources.
Each Cloud Composer environment has its own Monitoring dashboard.
Familiarize yourself with the key metrics below and locate each metric in the Monitoring dashboard:
In the Google Cloud console, go to the Environments page.
In the list of environments, click the name of your environment. The Environment details page opens.
Go to the Monitoring tab.
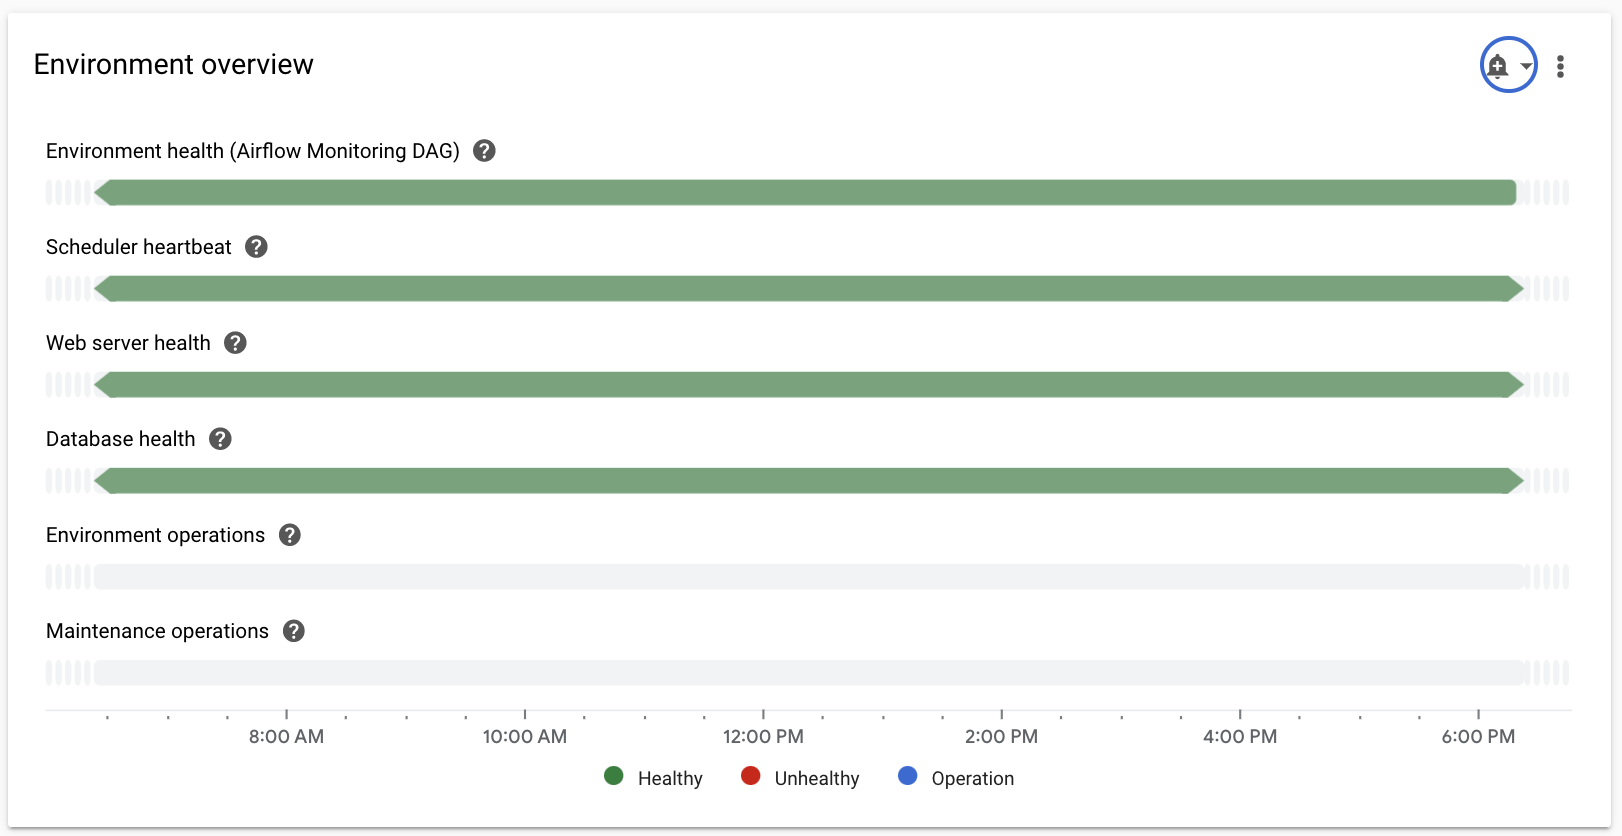
Select the Overview section, locate the Environment Overview item on the dashboard, and observe the Environment health (Airflow monitoring DAG) metric.
This timeline shows the health of the Cloud Composer environment. The green color of the environment health bar indicates that the environment is healthy, while the not healthy environment status is indicated with red color.
Every few minutes, Cloud Composer executes a liveness DAG named
airflow_monitoring. If the liveness DAG run finishes successfully, the health status isTrue. If the liveness DAG run fails (for example, because of Pod eviction, external process termination, or maintenance), the health status isFalse.
Select the SQL database section, locate the Database health item on the dashboard, and observe the Database health metric.
This timeline shows the status of the connection to the Cloud SQL instance of your environment. The green Database health bar indicates connectivity, while failures to connect are indicated with red color.
The Airflow monitoring Pod pings the database periodically and reports health status as
Trueif a connection can be established or asFalseif not.
In the Database health item, observe the Database CPU usage and Database memory usage metrics.
The Database CPU usage graph indicates the usage of CPU cores by the Cloud SQL database instances of your environment versus the total available database CPU limit.
The Database memory usage graph indicates the usage of memory by the Cloud SQL database instances of your environment versus the total available database memory limit.
Select the Schedulers section, locate the Scheduler heartbeat item on the dashboard, and observe the Scheduler heartbeat metric.
This timeline shows the health of the Airflow scheduler. Check for red areas to identify Airflow scheduler issues. If your environment has more than one scheduler, then the heartbeat status is healthy as long as at least one of the schedulers is responding.
The scheduler is considered unhealthy if the last heartbeat was received more than 30 seconds (default value) before the current time.
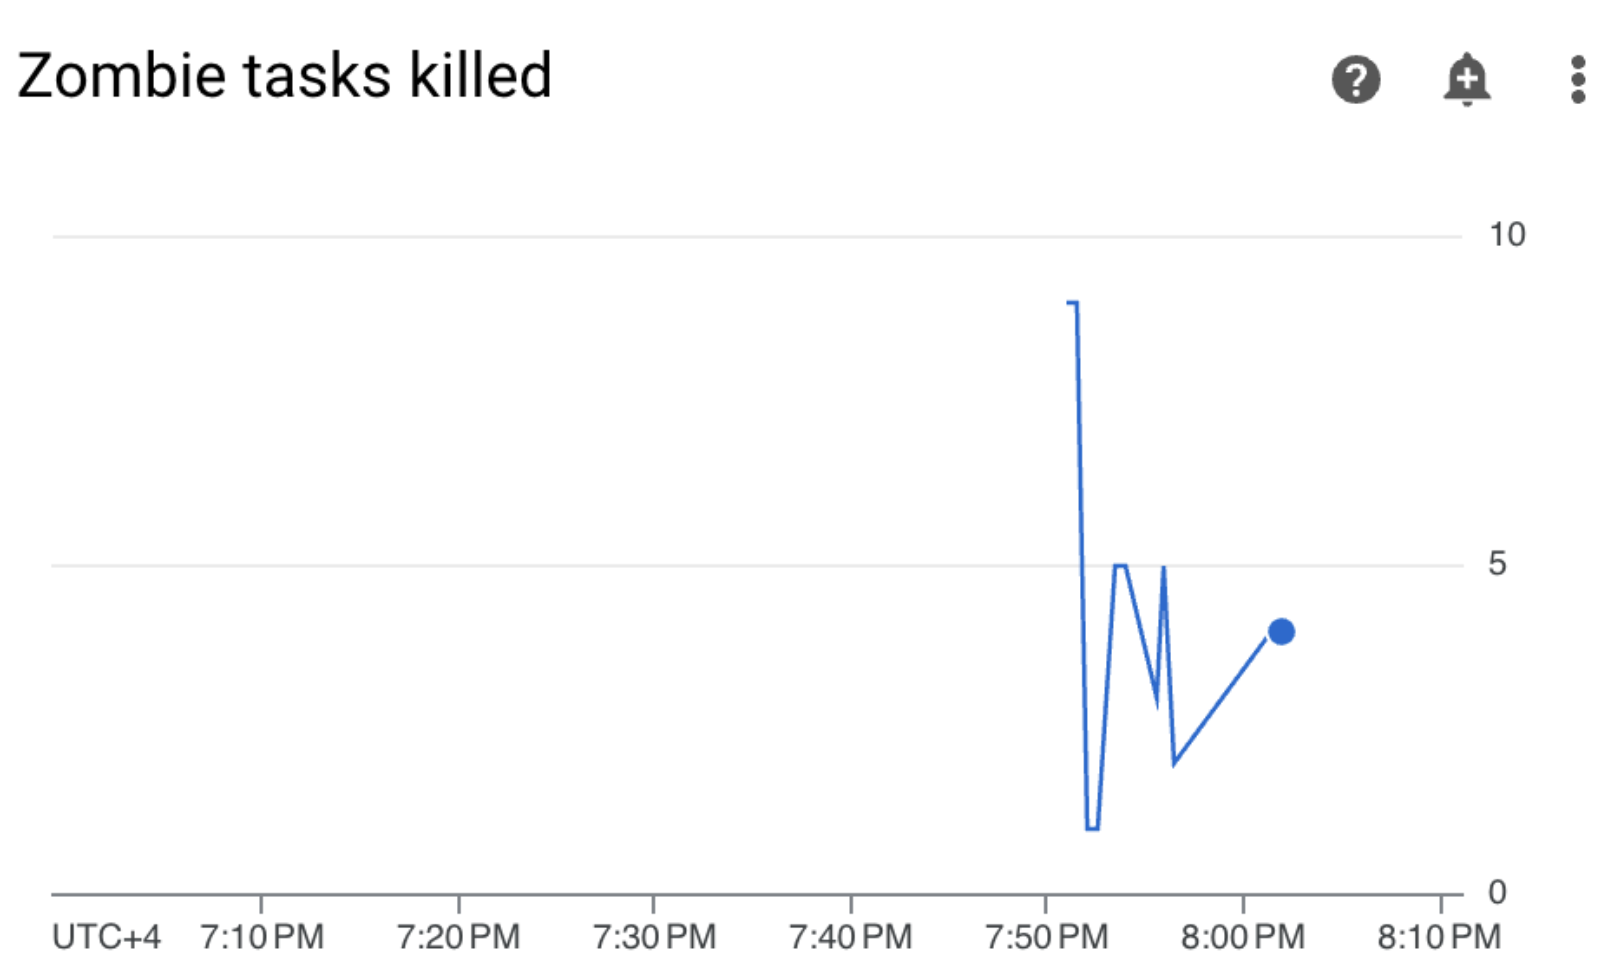
Select the DAG statistics section, locate the Zombie tasks killed item on the dashboard, and observe the Zombie tasks killed metric.
This The graph indicates the number of zombie tasks killed in a small time window. Zombie tasks are often caused by the external termination of Airflow processes (such as when a task's process is killed).
The Airflow scheduler kills zombie tasks periodically, which is reflected in this chart.
Select the Workers section, locate the Worker container restarts item on the dashboard, and observe the Worker container restarts metric.
- A graph indicates the total number of restarts for individual worker containers. Too many container restarts can affect the availability of your service or other services downstream that use it as a dependency.
Learn benchmarks and possible corrective actions for key metrics
The following list describes benchmark values that can indicate issues and provides corrective actions that you might take to address these issues.
Environment health (Airflow monitoring DAG)
Less than 90% success ratio over a 4-hour-long window
Failures can mean Pod evictions or worker terminations because the environment is overloaded or malfunctions. Red areas on the environment health timeline usually correlate with red areas in the other health bars of the individual environment components. Identify the root cause by reviewing other metrics in the Monitoring dashboard.
Database health
Less than 95% success ratio over a 4-hour-long window
Failures mean that there are problems with connectivity to the Airflow database, which could be a result of a database crash or downtime because the database is overloaded (for example, because of high CPU or memory usage or higher latency while connecting to the database). These symptoms most frequently are caused by sub-optimal DAGs, such as when DAGs use many globally-defined Airflow or environment variables. Identify the root cause by reviewing the SQL database resource usage metrics. You can also inspect the scheduler logs for errors related to the database connectivity.
Database CPU and memory usage
More than 80% in average CPU or memory usage within a 12-hour-long window
The database might be overloaded. Analyze the correlation between your DAG runs and spikes in database CPU or memory usage.
You can reduce the database load through more efficient DAGs with optimized running queries and connections, or by spreading the load more evenly over time.
As an alternative, you can allocate more CPU or memory to the database. Database resources are controlled by the environment size property of your environment, and the environment must be scaled to a larger size.
Scheduler heartbeat
Less than 90% success ratio over a 4-hour-long window
Assign more resources to the scheduler or increase the number of schedulers from 1 to 2 (recommended).
Zombie tasks killed
More than one zombie task per 24 hours
The most common reason for zombie tasks is the shortage of CPU or memory resources in your environment's cluster. Review worker resource usage graphs and assign more resources to your workers, or increase the zombie tasks timeout so that the scheduler waits longer before considering a task a zombie.
Worker container restarts
More than one restart per 24 hours
The most common reason is a lack of worker memory or storage. Look into worker resource consumption and allocate more memory or storage to your workers. If the lack of resources is not the reason, look into troubleshooting worker restart incidents and use Logging queries to discover the reasons for worker restarts.
Create notification channels
Follow the instructions outlined in Create a notification channel to create an email notification channel.
For more information about notification channels, see Manage notification channels.
Create alerting policies
Create alerting policies based on the benchmarks provided in the previous sections of this tutorial to continuously monitor the values of metrics and receive notifications when those metrics violate a condition.
Console
You can set up alerts for each metric presented in the Monitoring dashboard by clicking the bell icon in the corner of the corresponding item:
Find each metric you want to monitor in the Monitoring dashboard and click the bell icon in the corner of the metric item. The Create alerting policy page opens.
In the Transform data section:
Configure the Within each time series section as described in the alerting policies configuration for the metric.
Click Next, then configure the Configure alert trigger section as described in the alerting policies configuration for the metric.
Click Next.
Configure the notifications. Expand the Notification channels menu and select the notification channel(s) that you created in the previous step.
Click OK.
In the Name the alert policy section, fill the Alert policy name field. Use a descriptive name for each of the metrics. Use the "Name the alert policy" value as described in the alerting policies configuration for the metric.
Click Next.
Review the alerting policy and click Create policy.
Environment health (Airflow monitoring DAG) metric - alerting policy configurations
- Metric name: Cloud Composer Environment - Healthy
- API: composer.googleapis.com/environment/healthy
Filters:
environment_name = [ENVIRONMENT_NAME]
location = [CLUSTER_LOCATION]
Transform data > Within each time series:
- Rolling window: Custom
- Custom value: 4
- Custom units: hour(s)
- Rolling window function: fraction true
Configure alert trigger:
- Condition types: Threshold
- Alert trigger: Any time series violates
- Threshold position: Below threshold
- Threshold value: 90
- Condition name: Environment health condition
Configure notifications and finalize alert:
- Name the alert policy: Airflow Environment Health
Database health metric - alerting policy configurations
- Metric name: Cloud Composer Environment - Database Healthy
- API: composer.googleapis.com/environment/database_health
Filters:
environment_name = [ENVIRONMENT_NAME]
location = [CLUSTER_LOCATION]
Transform data > Within each time series:
- Rolling window: Custom
- Custom value: 4
- Custom units: hour(s)
- Rolling window function: fraction true
Configure alert trigger:
- Condition types: Threshold
- Alert trigger: Any time series violates
- Threshold position: Below threshold
- Threshold value: 95
- Condition name: Database health condition
Configure notifications and finalize alert:
- Name the alert policy: Airflow Database Health
Database CPU usage metric - alerting policy configurations
- Metric name: Cloud Composer Environment - Database CPU Utilization
- API: composer.googleapis.com/environment/database/cpu/utilization
Filters:
environment_name = [ENVIRONMENT_NAME]
location = [CLUSTER_LOCATION]
Transform data > Within each time series:
- Rolling window: Custom
- Custom value: 12
- Custom units: hour(s)
- Rolling window function: mean
Configure alert trigger:
- Condition types: Threshold
- Alert trigger: Any time series violates
- Threshold position: Above threshold
- Threshold value: 80
- Condition name: Database CPU usage condition
Configure notifications and finalize alert:
- Name the alert policy: Airflow Database CPU Usage
Database memory usage metric - alerting policy configurations
- Metric name: Cloud Composer Environment - Database Memory Utilization
- API: composer.googleapis.com/environment/database/memory/utilization
Filters:
environment_name = [ENVIRONMENT_NAME]
location = [CLUSTER_LOCATION]
Transform data > Within each time series:
- Rolling window: Custom
- Custom value: 12
- Custom units: hour(s)
- Rolling window function: mean
Configure alert trigger:
- Condition types: Threshold
- Alert trigger: Any time series violates
- Threshold position: Above threshold
- Threshold value: 80
- Condition name: Database memory usage condition
Configure notifications and finalize alert:
- Name the alert policy: Airflow Database Memory Usage
Scheduler heartbeats metric - alerting policy configurations
- Metric name: Cloud Composer Environment - Scheduler Heartbeats
- API: composer.googleapis.com/environment/scheduler_heartbeat_count
Filters:
environment_name = [ENVIRONMENT_NAME]
location = [CLUSTER_LOCATION]
Transform data > Within each time series:
- Rolling window: Custom
- Custom value: 4
- Custom units: hour(s)
- Rolling window function: count
Configure alert trigger:
- Condition types: Threshold
- Alert trigger: Any time series violates
- Threshold position: Below threshold
Threshold value: 216
- You can obtain this number by running a query that aggregates value
_scheduler_heartbeat_count_meanin the Metrics Explorer Query Editor.
- You can obtain this number by running a query that aggregates value
Condition name: Scheduler heartbeat condition
Configure notifications and finalize alert:
- Name the alert policy: Airflow Scheduler Heartbeat
Zombie tasks killed metric - alerting policy configurations
- Metric name: Cloud Composer Environment - Zombie Tasks Killed
- API: composer.googleapis.com/environment/zombie_task_killed_count
Filters:
environment_name = [ENVIRONMENT_NAME]
location = [CLUSTER_LOCATION]
Transform data > Within each time series:
- Rolling window: 1 day
- Rolling window function: sum
Configure alert trigger:
- Condition types: Threshold
- Alert trigger: Any time series violates
- Threshold position: Above threshold
- Threshold value: 1
- Condition name: Zombie tasks condition
Configure notifications and finalize alert:
- Name the alert policy: Airflow Zombie Tasks
Worker container restarts metric - alerting policy configurations
- Metric name: Kubernetes Container - Restart Count
- API: kubernetes.io/container/restart_count
Filters:
environment_name = [ENVIRONMENT_NAME] location = [CLUSTER_LOCATION] pod_name =~ airflow-worker-.*|airflow-k8s-worker-.* container_name =~ airflow-worker|base cluster_name = [CLUSTER_NAME]CLUSTER_NAMEis your environment's cluster name that can be found under Environment Configuration > Resources > GKE cluster in Google Cloud console.Transform data > Within each time series:
- Rolling window: 1 day
- Rolling window function: rate
Configure alert trigger:
- Condition types: Threshold
- Alert trigger: Any time series violates
- Threshold position: Above threshold
- Threshold value: 1
- Condition name: Worker container restarts condition
Configure notifications and finalize alert:
- Name the alert policy: Airflow Worker Restarts
Terraform
Run a Terraform script that creates an email notification channel and uploads alerting policies for the key metrics provided in this tutorial based on their respective benchmarks:
- Save the example Terraform file on your local computer.
Replace the following:
PROJECT_ID: the Project ID of your project. For example,example-project.EMAIL_ADDRESS: the email address that must be notified in case an alert is triggered.ENVIRONMENT_NAME: your Cloud Composer environment's name. For example,example-composer-environment.CLUSTER_NAME: your environment cluster name that can be found under Environment Configuration > Resources > GKE cluster in Google Cloud console.
resource "google_monitoring_notification_channel" "basic" {
  project      = "PROJECT_ID"
  display_name = "Test Notification Channel"
  type         = "email"
  labels = {
    email_address = "EMAIL_ADDRESS"
  }
  # force_delete = false
}

resource "google_monitoring_alert_policy" "environment_health_metric" {
  project      = "PROJECT_ID"
  display_name = "Airflow Environment Health"
  combiner     = "OR"
  notification_channels = [google_monitoring_notification_channel.basic.name] // To manually add a notification channel add it with the syntax "projects/[PROJECT_ID]/notificationChannels/[CHANNEL_ID]"
  conditions {
    display_name = "Environment health condition"
    condition_threshold {
      filter     = "resource.type = \"cloud_composer_environment\" AND metric.type=\"composer.googleapis.com/environment/healthy\" AND resource.label.environment_name=\"ENVIRONMENT_NAME\""
      duration   = "60s"
      comparison = "COMPARISON_LT"
      threshold_value = 0.9
      aggregations {
        alignment_period   = "14400s"
        per_series_aligner = "ALIGN_FRACTION_TRUE"
      }
    }
  }

}

resource "google_monitoring_alert_policy" "database_health_metric" {
  project      = "PROJECT_ID"
  display_name = "Airflow Database Health"
  combiner     = "OR"
  notification_channels = [google_monitoring_notification_channel.basic.name] // To manually add a notification channel add it with the syntax "projects/[PROJECT_ID]/notificationChannels/[CHANNEL_ID]"
  conditions {
    display_name = "Database health condition"
    condition_threshold {
      filter     = "resource.type = \"cloud_composer_environment\" AND metric.type=\"composer.googleapis.com/environment/database_health\" AND resource.label.environment_name=\"ENVIRONMENT_NAME\""
      duration   = "60s"
      comparison = "COMPARISON_LT"
      threshold_value = 0.95
      aggregations {
        alignment_period   = "14400s"
        per_series_aligner = "ALIGN_FRACTION_TRUE"
      }
    }
  }
}

resource "google_monitoring_alert_policy" "alert_database_cpu_usage" {
  project      = "PROJECT_ID"
  display_name = "Airflow Database CPU Usage"
  combiner     = "OR"
  notification_channels = [google_monitoring_notification_channel.basic.name] // To manually add a notification channel add it with the syntax "projects/[PROJECT_ID]/notificationChannels/[CHANNEL_ID]"
  conditions {
    display_name = "Database CPU usage condition"
    condition_threshold {
      filter     = "resource.type = \"cloud_composer_environment\" AND metric.type=\"composer.googleapis.com/environment/database/cpu/utilization\" AND resource.label.environment_name=\"ENVIRONMENT_NAME\""
      duration   = "60s"
      comparison = "COMPARISON_GT"
      threshold_value = 80
      aggregations {
        alignment_period   = "43200s"
        per_series_aligner = "ALIGN_MEAN"
      }
    }
  }
}

resource "google_monitoring_alert_policy" "alert_database_memory_usage" {
  project      = "PROJECT_ID"
  display_name = "Airflow Database Memory Usage"
  combiner     = "OR"
  notification_channels = [google_monitoring_notification_channel.basic.name] // To manually add a notification channel add it with the syntax "projects/[PROJECT_ID]/notificationChannels/[CHANNEL_ID]"
  conditions {
    display_name = "Database memory usage condition"
    condition_threshold {
      filter     = "resource.type = \"cloud_composer_environment\" AND metric.type=\"composer.googleapis.com/environment/database/memory/utilization\" AND resource.label.environment_name=\"ENVIRONMENT_NAME\""
      duration   = "60s"
      comparison = "COMPARISON_GT"
      threshold_value = 80
      aggregations {
        alignment_period   = "43200s"
        per_series_aligner = "ALIGN_MEAN"
      }
    }
  }
}

resource "google_monitoring_alert_policy" "alert_scheduler_heartbeat" {
  project      = "PROJECT_ID"
  display_name = "Airflow Scheduler Heartbeat"
  combiner     = "OR"
  notification_channels = [google_monitoring_notification_channel.basic.name] // To manually add a notification channel add it with the syntax "projects/[PROJECT_ID]/notificationChannels/[CHANNEL_ID]"
  conditions {
    display_name = "Scheduler heartbeat condition"
    condition_threshold {
      filter     = "resource.type = \"cloud_composer_environment\" AND metric.type=\"composer.googleapis.com/environment/scheduler_heartbeat_count\" AND resource.label.environment_name=\"ENVIRONMENT_NAME\""
      duration   = "60s"
      comparison = "COMPARISON_LT"
      threshold_value = 216 // Threshold is 90% of the average for composer.googleapis.com/environment/scheduler_heartbeat_count metric in an idle environment
      aggregations {
        alignment_period   = "14400s"
        per_series_aligner = "ALIGN_COUNT"
      }
    }
  }
}

resource "google_monitoring_alert_policy" "alert_zombie_task" {
  project      = "PROJECT_ID"
  display_name = "Airflow Zombie Tasks"
  combiner     = "OR"
  notification_channels = [google_monitoring_notification_channel.basic.name] // To manually add a notification channel add it with the syntax "projects/[PROJECT_ID]/notificationChannels/[CHANNEL_ID]"
  conditions {
    display_name = "Zombie tasks condition"
    condition_threshold {
      filter     = "resource.type = \"cloud_composer_environment\" AND metric.type=\"composer.googleapis.com/environment/zombie_task_killed_count\" AND  resource.label.environment_name=\"ENVIRONMENT_NAME\""
      duration   = "60s"
      comparison = "COMPARISON_GT"
      threshold_value = 1
      aggregations {
        alignment_period   = "86400s"
        per_series_aligner = "ALIGN_SUM"
      }
    }
  }
}

resource "google_monitoring_alert_policy" "alert_worker_restarts" {
  project      = "PROJECT_ID"
  display_name = "Airflow Worker Restarts"
  combiner     = "OR"
  notification_channels = [google_monitoring_notification_channel.basic.name] // To manually add a notification channel add it with the syntax "projects/[PROJECT_ID]/notificationChannels/[CHANNEL_ID]"
  conditions {
    display_name = "Worker container restarts condition"
    condition_threshold {
      filter     = "resource.type = \"k8s_container\" AND (resource.labels.cluster_name = \"CLUSTER_NAME\" AND resource.labels.container_name = monitoring.regex.full_match(\"airflow-worker|base\") AND resource.labels.pod_name = monitoring.regex.full_match(\"airflow-worker-.*|airflow-k8s-worker-.*\")) AND metric.type = \"kubernetes.io/container/restart_count\""

      duration   = "60s"
      comparison = "COMPARISON_GT"
      threshold_value = 1
      aggregations {
        alignment_period   = "86400s"
        per_series_aligner = "ALIGN_RATE"
      }
    }
  }
}
Test the alerting policies
This section describes how to test the created alerting policies and interpret results.
Upload a sample DAG
The sample DAG memory_consumption_dag.py provided in this tutorial imitates
intensive worker memory utilization. The DAG contains 4 tasks, each of the
tasks writes data to a sample string, consuming 380 MB of memory. The sample
DAG is scheduled to run every 2 minutes and will start running automatically
once you upload it to your Composer environment.
Upload the following sample DAG to the environment that you created in the previous steps:
from datetime import datetime
import sys
import time

from airflow import DAG
from airflow.operators.python import PythonOperator


def ram_function():
    data = ""
    start = time.time()
    for i in range(38):
        data += "a" * 10 * 1000**2
        time.sleep(0.2)
        print(f"{i}, {round(time.time() - start, 4)}, {sys.getsizeof(data) / (1000 ** 3)}")
    print(f"Size={sys.getsizeof(data) / (1000 ** 3)}GB")
    time.sleep(30 - (time.time() - start))
    print(f"Complete in {round(time.time() - start, 2)} seconds!")


with DAG(
    dag_id="memory_consumption_dag",
    start_date=datetime(2023, 1, 1, 1, 1, 1),
    schedule="1/2 * * * *",
    catchup=False,
) as dag:
    for i in range(4):
        PythonOperator(
            task_id=f"task_{i+1}",
            python_callable=ram_function,
            retries=0,
            dag=dag,
        )
Interpret alerts and metrics in Monitoring
Wait for about 10 minutes after the sample DAG starts running and evaluate the test results:
Check your email mailbox to verify that you received a notification from Google Cloud Alerting with the subject line that starts with
[ALERT]. Content of this message contains the alerting policy incident details.Click the View Incident button in the email notification. You are redirected to Metrics Explorer. Review the details of the alerting incident:

Figure 2. Details of the alerting incident (click to enlarge) The incident metrics graph indicates that the metrics you created exceeded the threshold of 1, meaning Airflow detected and killed more than 1 zombie task.
In your Cloud Composer environment, go to the Monitoring tab, open the DAG statistics section, and find the Zombie tasks killed graph:

Figure 3. Zombie tasks graph (click to enlarge) The graph indicates that Airflow killed about 20 zombie tasks within just the first 10 minutes of running the sample DAG.
According to the benchmarks and corrective actions, the most common reason for zombie tasks is lack of worker memory or CPU. Identify the root cause of zombie tasks by analyzing your worker resource utilization.
Open the Workers section in your Monitoring dashboard and review the worker CPU and memory usage metrics:

Figure 4.Worker CPU and memory usage metrics (click to enlarge) The Total workers CPU usage graph indicates that the worker CPU usage was below 50% of the total available limit at all times, thus the available CPU is sufficient. The Total workers memory usage graph shows that running the sample DAG resulted in hitting the allocatable memory limit which equals nearly 75% of the total memory limit shown on the graph (GKE reserves 25% of the first 4 GiB of memory and an additional 100 MiB of memory on every node to handle Pod eviction).
You can conclude that the workers lack the memory resources to run the sample DAG successfully.
Optimize your environment and evaluate its performance
Based on the analysis of worker resource utilization, you need to allocate more memory to your workers for all the tasks in your DAG to succeed.
In your Composer environment, open the DAGs tab, click on the name of the sample DAG (
memory_consumption_dag), then click Pause DAG.Allocate additional worker memory:
In the Environment configuration tab, find the Resources > Workloads configuration and click Edit.
In the Worker item, increase the Memory limit. In this tutorial, use 3.25 GB.
Save the changes and allow several minutes for the worker to restart.
Open the DAGs tab, click on the name of the sample DAG (
memory_consumption_dag), and click Unpause DAG.
Go to Monitoring and verify that no new zombie tasks appeared after you updated your worker resource limits:
Summary
In this tutorial, you learned about the key environment-level health and performance metrics, how to set up alerting policies for each metric, and how to interpret each metric into corrective actions. You then ran a sample DAG, identified the root cause of environment health issues with the help of alerts and Monitoring charts, and optimized your environment by allocating more memory to your workers. However, it is recommended to optimize your DAGs to reduce worker resource consumption in the first place, because it is not possible to increase the resources beyond a certain threshold.
Clean up
To avoid incurring charges to your Google Cloud account for the resources used in this tutorial, either delete the project that contains the resources or keep the project and delete the individual resources.
Delete the project
- In the Google Cloud console, go to the Manage resources page.
- In the project list, select the project that you want to delete, and then click Delete.
- In the dialog, type the project ID, and then click Shut down to delete the project.
Delete individual resources
If you plan to explore multiple tutorials and quickstarts, reusing projects can help you avoid exceeding project quota limits.
Console
- Delete the Cloud Composer environment. You also delete the environment's bucket during this procedure.
- Delete each of the alerting policies that you created in Cloud Monitoring.
Terraform
- Make sure that your Terraform script doesn't contain entries for resources that are still required by your project. For example, you might want to keep some APIs enabled and IAM permissions still assigned (if you added such definitions to your Terraform script).
- Run
terraform destroy. - Manually delete the environment's bucket. Cloud Composer doesn't delete it automatically. You can do it from the Google Cloud console or Google Cloud CLI.