Cloud Composer 3 | Cloud Composer 2 | Cloud Composer 1
This page explains how to tune your environment's scale and performance parameters to the needs of your project, so that you get improved performance and reduce costs for resources that are not utilized by your environment.
Other pages about scaling and optimization:
- For information about scaling your environments, see Scale environments.
- For information about how environment scaling works, see Environment scaling.
- For a tutorial on monitoring key environment metrics, see Monitor environment health and performance with key metrics.
Optimization process overview
Making changes to the parameters of your environment can affect many aspects of your environment's performance. We recommend to optimize your environment in iterations:
- Start with environment presets.
- Run your DAGs.
- Observe your environment's performance.
- Adjust your environment scale and performance parameters, then repeat from the previous step.
Start with environment presets
When you create an environment in Google Cloud console, you can select one of three environment presets. These presets set the initial scale and performance configuration of your environment; after you create your environment, you can change all scale and performance parameters provided by a preset.
We recommend to start with one of the presets, based on the following estimates:
- Total number of DAGs that you plan to deploy in the environment
- Maximum number of concurrent DAG runs
- Maximum number of concurrent tasks
Your environment's performance depends on the implementation of specific DAGs that you run in your environment. The following table lists estimates that are based on the average resource consumption. If you expect your DAGs to consume more resources, adjust the estimates accordingly.
| Recommended preset | Total DAGs | Max concurrent DAG runs | Max concurrent tasks |
|---|---|---|---|
| Small | 50 | 15 | 18 |
| Medium | 250 | 60 | 100 |
| Large | 1000 | 250 | 400 |
For example, an environment must run 40 DAGs. All DAGs must run at the same time with one active task each. This environment would then use a Medium preset, because the maximum number of concurrent DAG runs and tasks exceed the recommended estimates for the Small preset.
Run your DAGs
Once your environment is created, upload your DAGs to it. Run your DAGs and observe the environment's performance.
We recommend to run your DAGs on a schedule that reflects the real-life application of your DAGs. For example, if you want to run multiple DAGs at the same time, make sure to check your environment's performance when all these DAGs are running simultaneously.
Observe your environment's performance
This section focuses on the most common Cloud Composer 2 capacity and performance tuning aspects. We recommend following this guide step by step because the most common performance considerations are covered first.
Go to the Monitoring dashboard
You can monitor your environment's performance metrics on the Monitoring dashboard of your environment.
To go to the Monitoring dashboard for your environment:
In the Google Cloud console, go to the Environments page.
Click the name of your environment.
Go to the Monitoring tab.
Monitor scheduler CPU and memory metrics
Airflow scheduler's CPU and memory metrics help you check whether the scheduler's performance is a bottleneck in the overall Airflow performance.
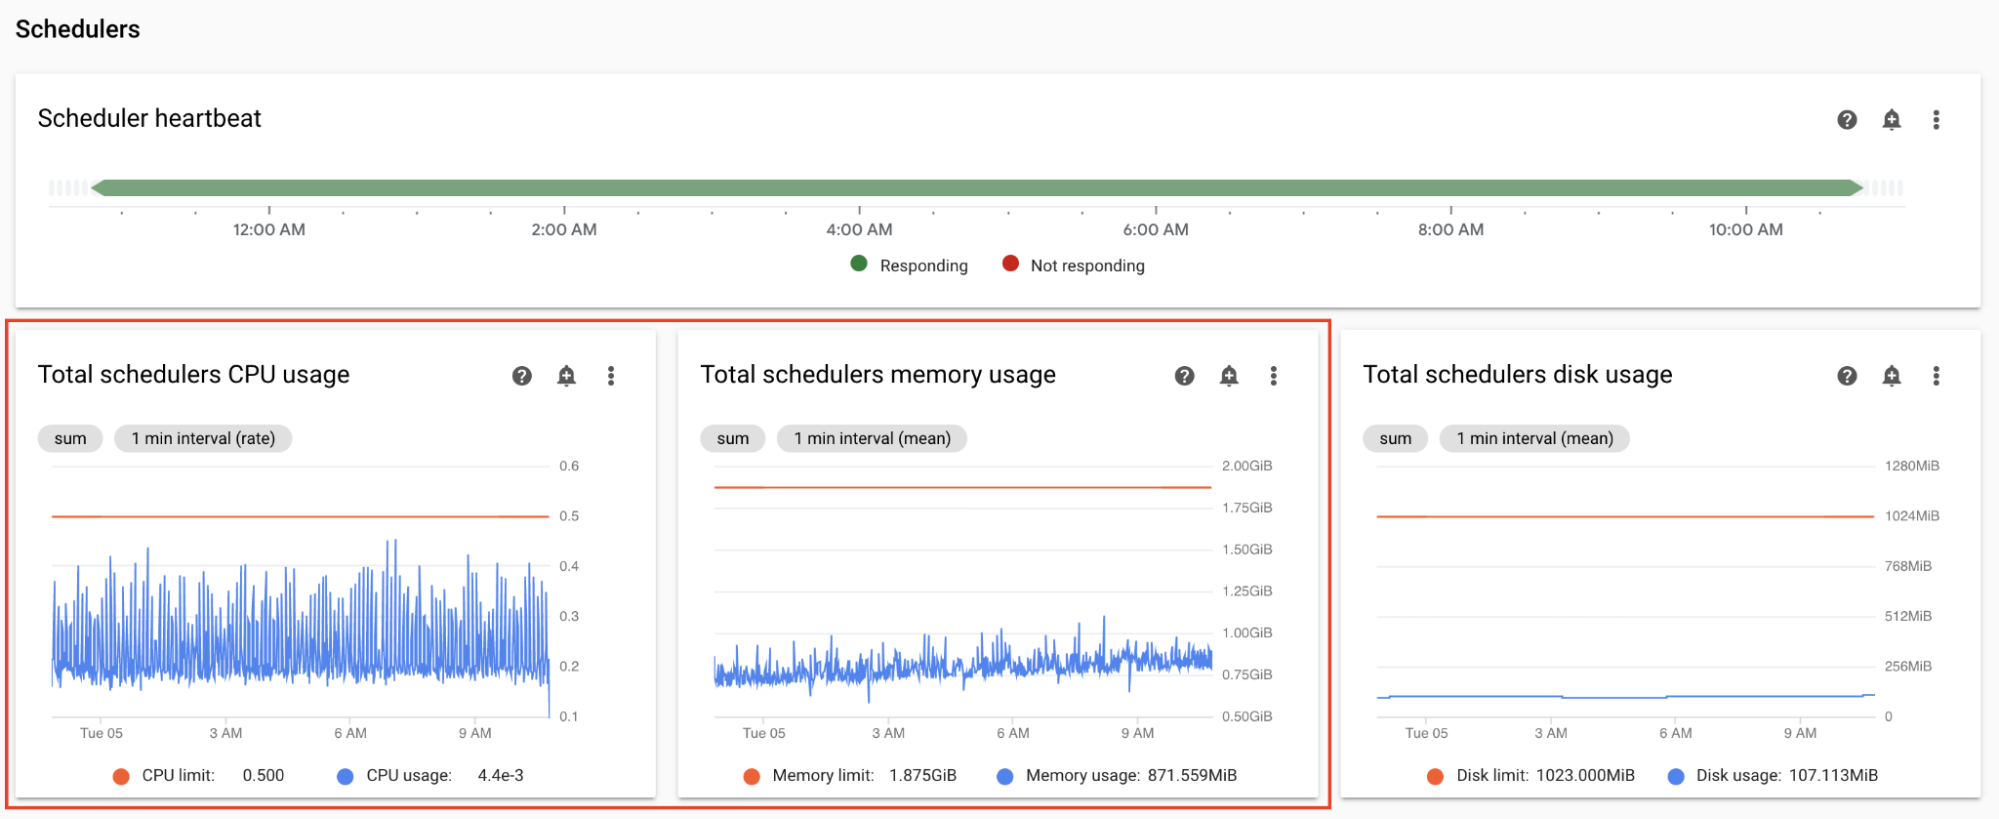
On the Monitoring dashboard, in the Schedulers section, observe graphs for the Airflow schedulers of your environment:
- Total schedulers CPU usage
- Total schedulers memory usage
Adjust according to your observations:
If the Scheduler CPU usage is consistently below 30%-35%, you might want to:
If Scheduler CPU usage exceeds 80% for longer than a few percent of the total time, you might want to:
Monitor the total parse time for all DAG files
The schedulers parse DAGs before scheduling DAG runs. If DAGs take a long time to parse, this consumes scheduler's capacity and might reduce the performance of DAG runs.
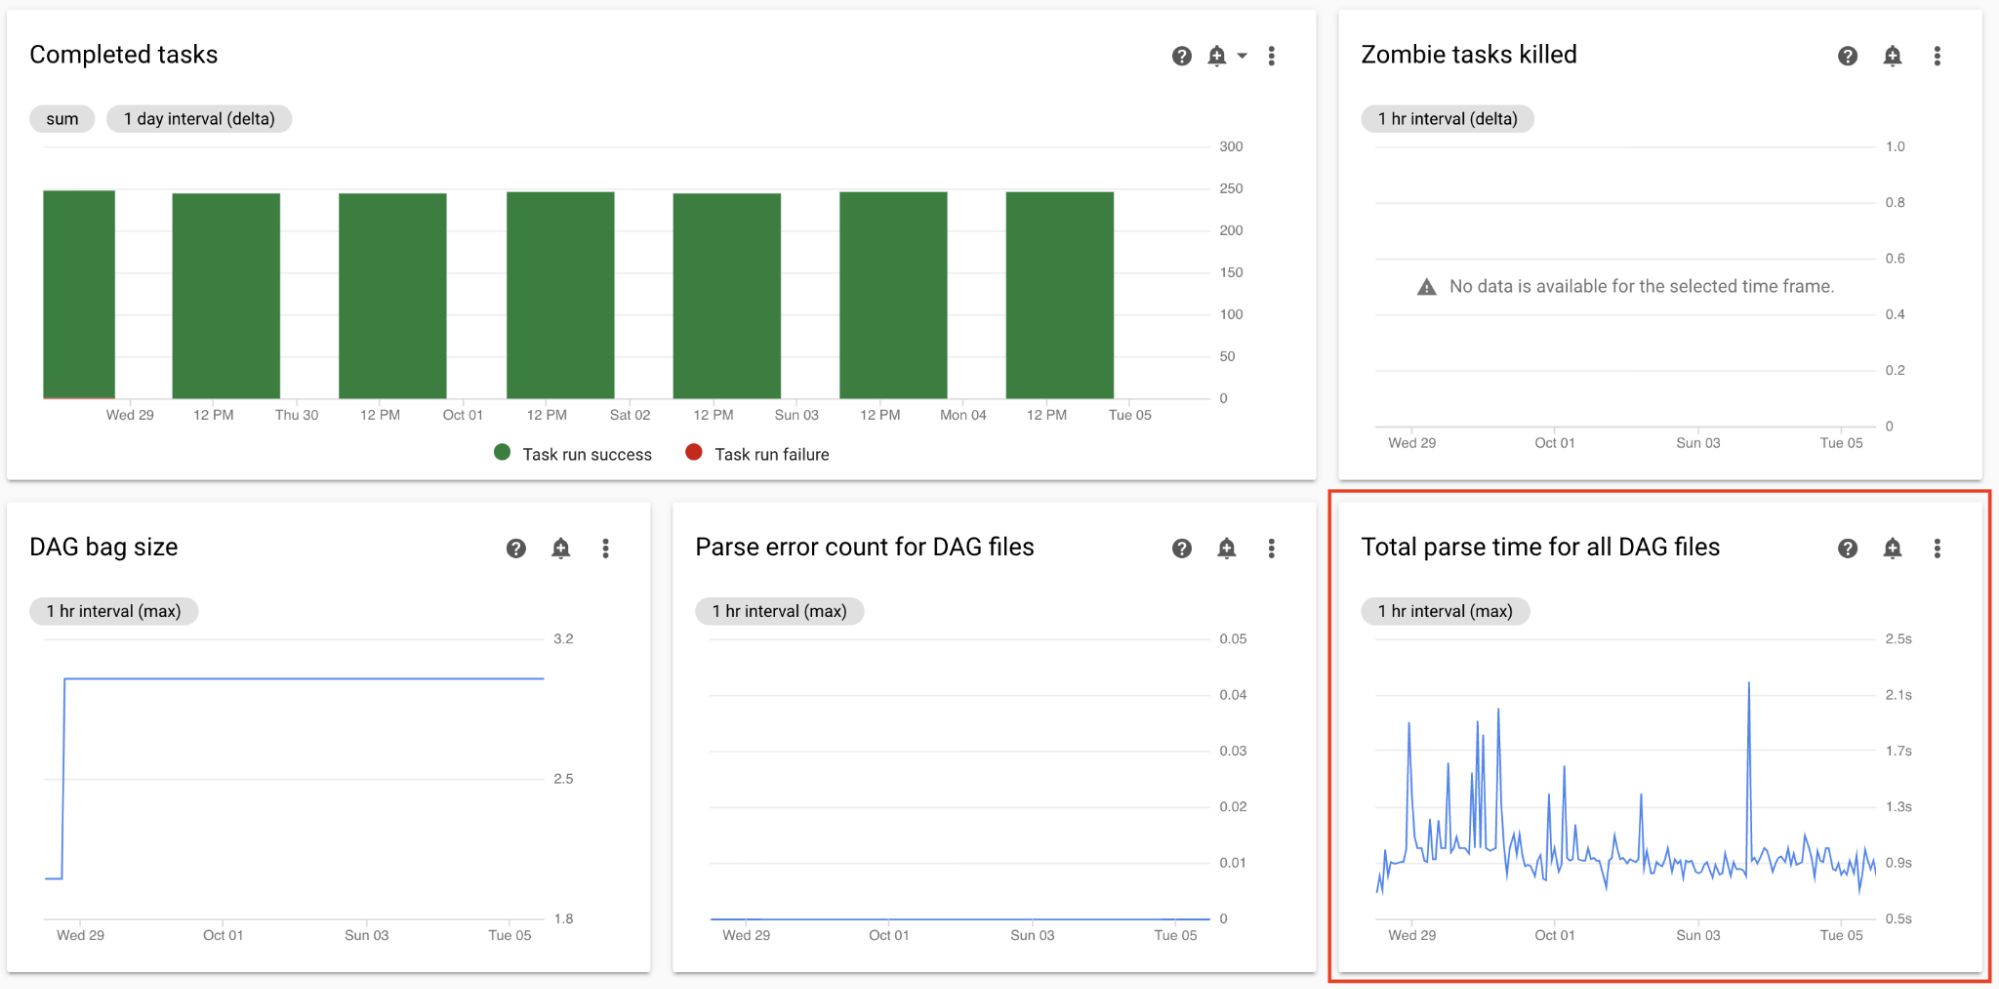
On the Monitoring dashboard, in the DAG Statistics section, observe graphs for the total DAG parse time.
If the number exceeds about 10 seconds, your schedulers might be overloaded with DAG parsing and cannot run DAGs effectively. The default DAG parsing frequency in Airflow is 30 seconds; if DAG parsing time exceeds this threshold, parsing cycles start to overlap, which then exhausts scheduler's capacity.
According to your observations, you might want to:
- Simplify your DAGs, including their Python dependencies.
- Increase the DAG file parsing interval and increase the DAG directory listing interval.
- Increase the number of schedulers.
- Increase the CPU of schedulers.
Monitor worker pod evictions
Pod eviction can happen when a particular pod in your environment's cluster reaches its resource limits.
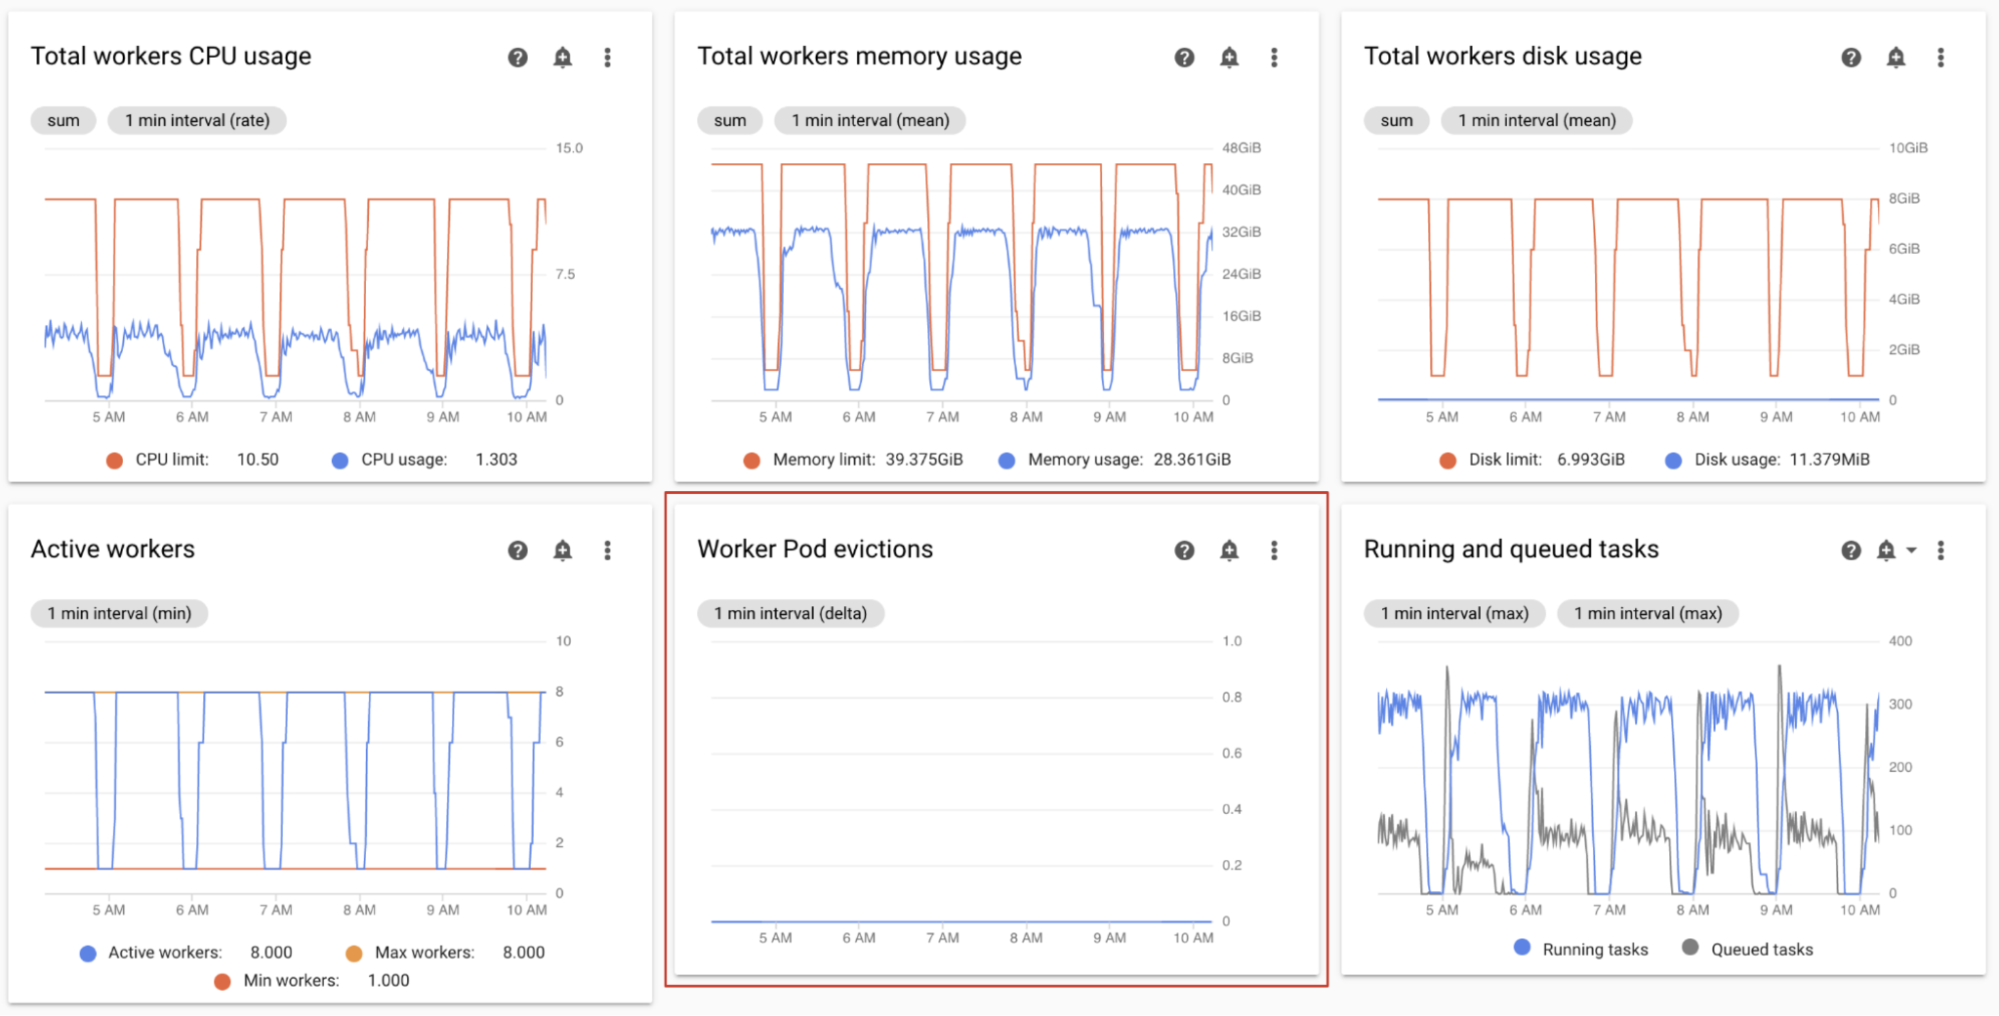
If an Airflow worker pod is evicted, all task instances running on that pod are interrupted, and later marked as failed by Airflow.
The majority of issues with worker pod evictions happen because of out-of-memory situations in workers.
On the Monitoring dashboard, in the Workers section, observe the Worker Pods evictions graphs for your environment.
The Total workers memory usage graph shows a total perspective of the environment. A single worker can still exceed the memory limit, even if the memory utilization is healthy at the environment level.
According to your observations, you might want to:
- Increase the memory available to workers.
- Reduce worker concurrency. In this way, a single worker handles fewer tasks at once. This provides more memory or storage to each individual task. If you change worker concurrency, you might also want to increase the maximum number of workers. In this way, the number of tasks that your environment can handle at once stays the same. For example, if you reduce worker Concurrency from 12 to 6, you might want to double the maximum number of workers.
Monitor active workers
The number of workers in your environment automatically scales in response to the queued tasks.
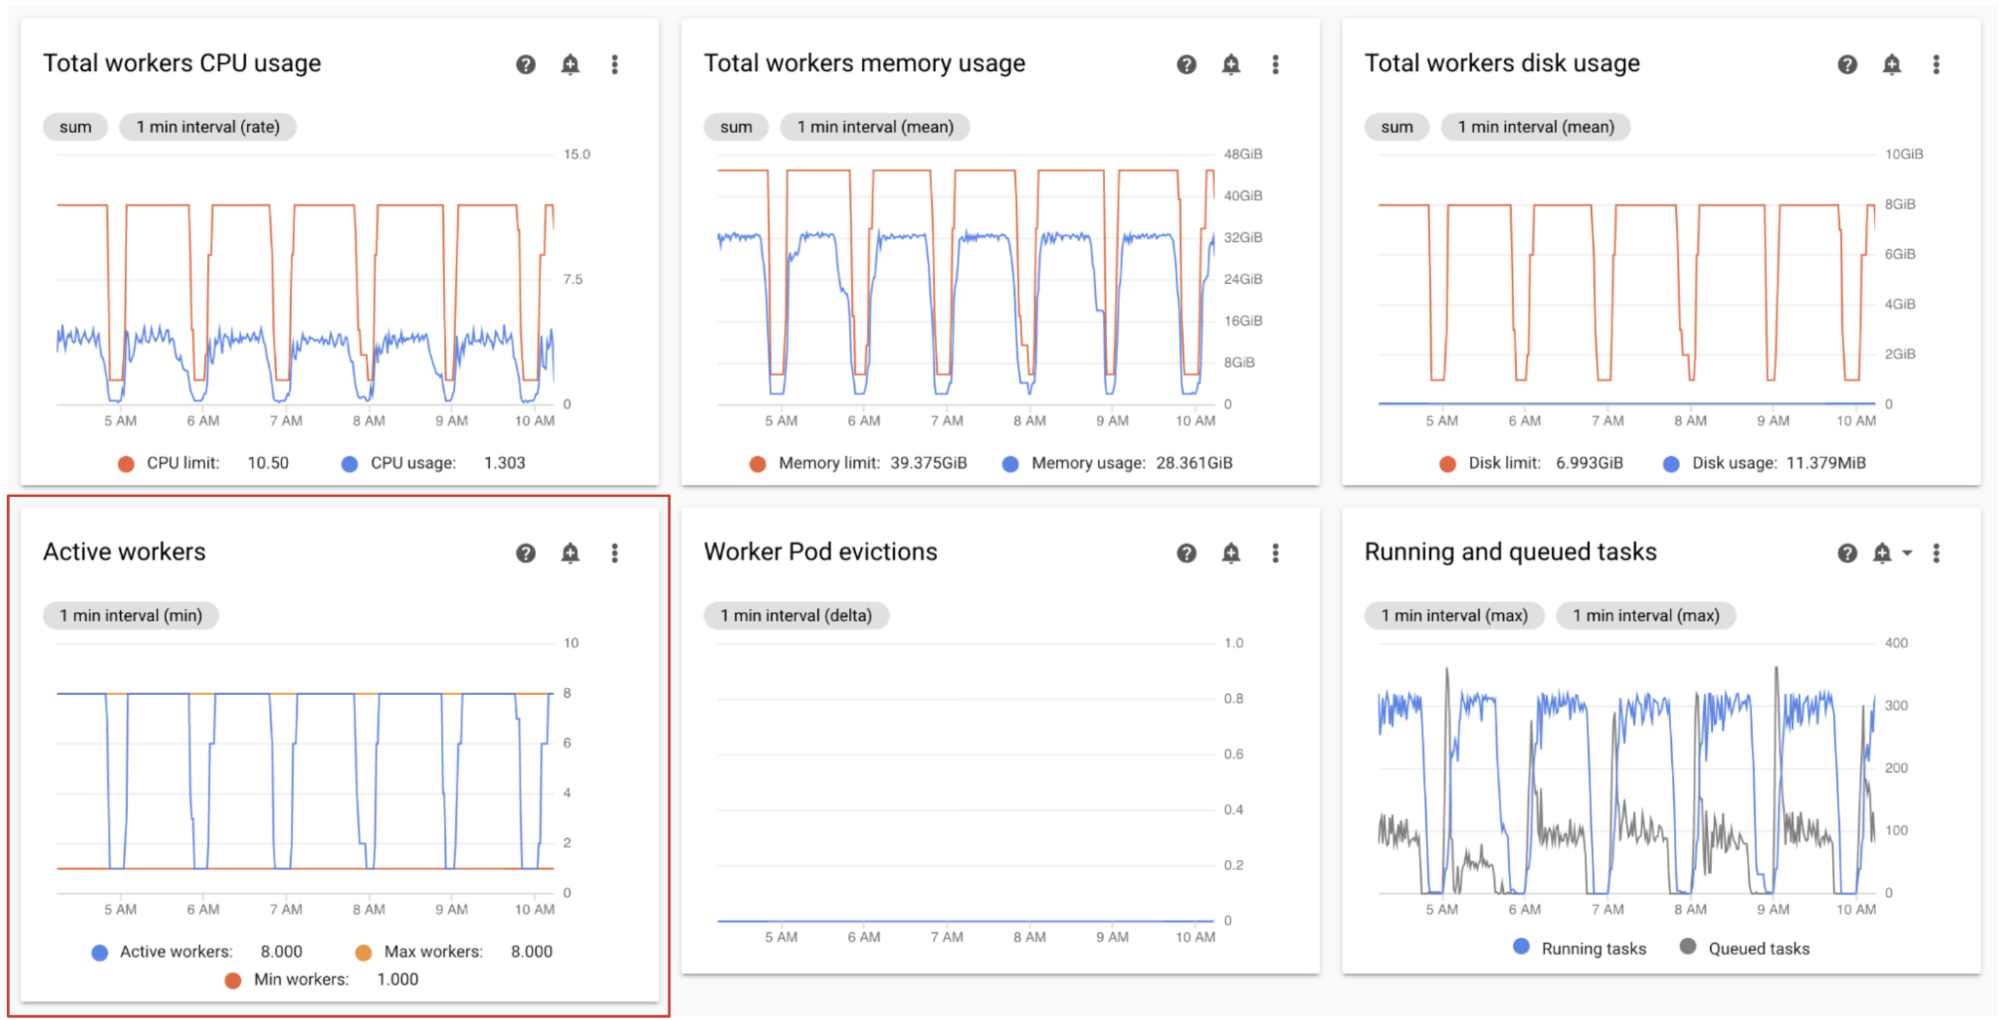
On the Monitoring dashboard, in the Workers section, observe graphs for the number of active workers and the number of tasks in the queue:
- Active workers
- Airflow tasks
Adjust according to your observations:
- If the environment frequently reaches its maximum limit for workers, and at the same time the number of tasks in the Celery queue is continuously high, you might want to increase the maximum number of workers.
If there are long inter-task scheduling delays, but at same time the environment does not scale up to its maximum number of workers, then there is likely an Airflow setting that throttles the execution and prevents Cloud Composer mechanisms from scaling the environment. Because Cloud Composer 2 environments scale based on the number of tasks in the Celery queue, configure Airflow to not throttle tasks on the way into the queue:
- Increase worker concurrency. Worker concurrency must be set to a value that is higher than the expected maximum number of concurrent tasks, divided by the maximum number of workers in the environment.
- Increase DAG concurrency, if a single DAG is running a large number of tasks in parallel, which can lead to reaching the maximum number of running task instances per DAG.
- Increase max active runs per DAG, if you run the same DAG multiple times in parallel, which can lead to Airflow throttling the execution because the max active runs per DAG limit is reached.
Monitor workers CPU and memory usage
Monitor the total CPU and memory usage aggregated across all workers in your environment to determine if Airflow workers utilize the resources of your environment properly.
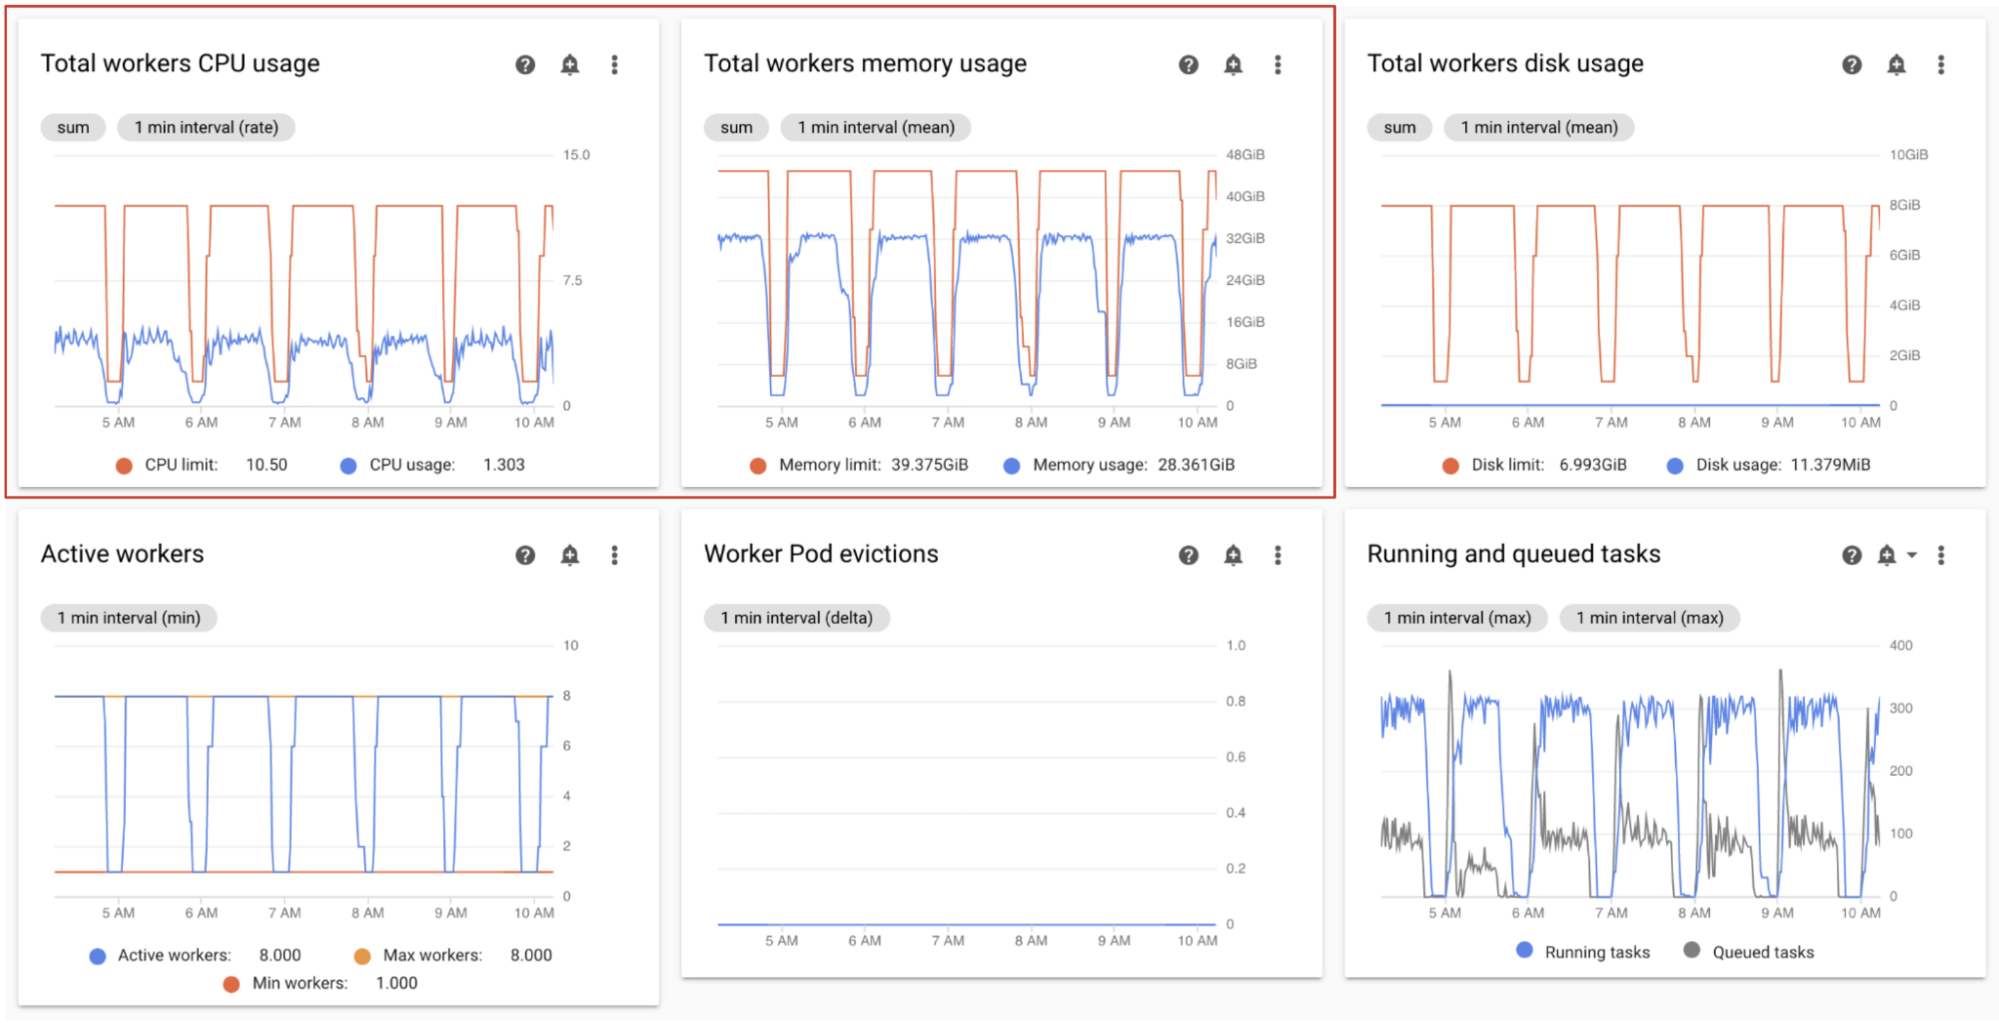
On the Monitoring dashboard, in the Workers section, observe graphs for the CPU and memory usage by Airflow workers:
- Total workers CPU usage
- Total workers memory usage
These graph represent aggregated resource usage; individual workers might still reach their capacity limits, even if the aggregate view shows spare capacity.
Adjust according to your observations:
- If the workers memory usage approaches the limit, this can cause worker pod evictions. To address this problem, increase worker memory.
- If the memory usage is minimal compared to the limit, and there are no worker pod evictions, you might want to decrease workers memory.
If the workers CPU usage approaches the limit (exceeds 80% for more than a few percent of the total time), you might want to:
- Increase the number of workers. This gives your environment more control over capacity provisioned for a particular workload.
- Increase Workers CPU or reduce worker concurrency, if individual tasks need higher CPU allocation. Otherwise, we recommend to increase the number of workers.
Monitor running and queued tasks
You can monitor the number of queued and running tasks to check the efficiency of the scheduling process.
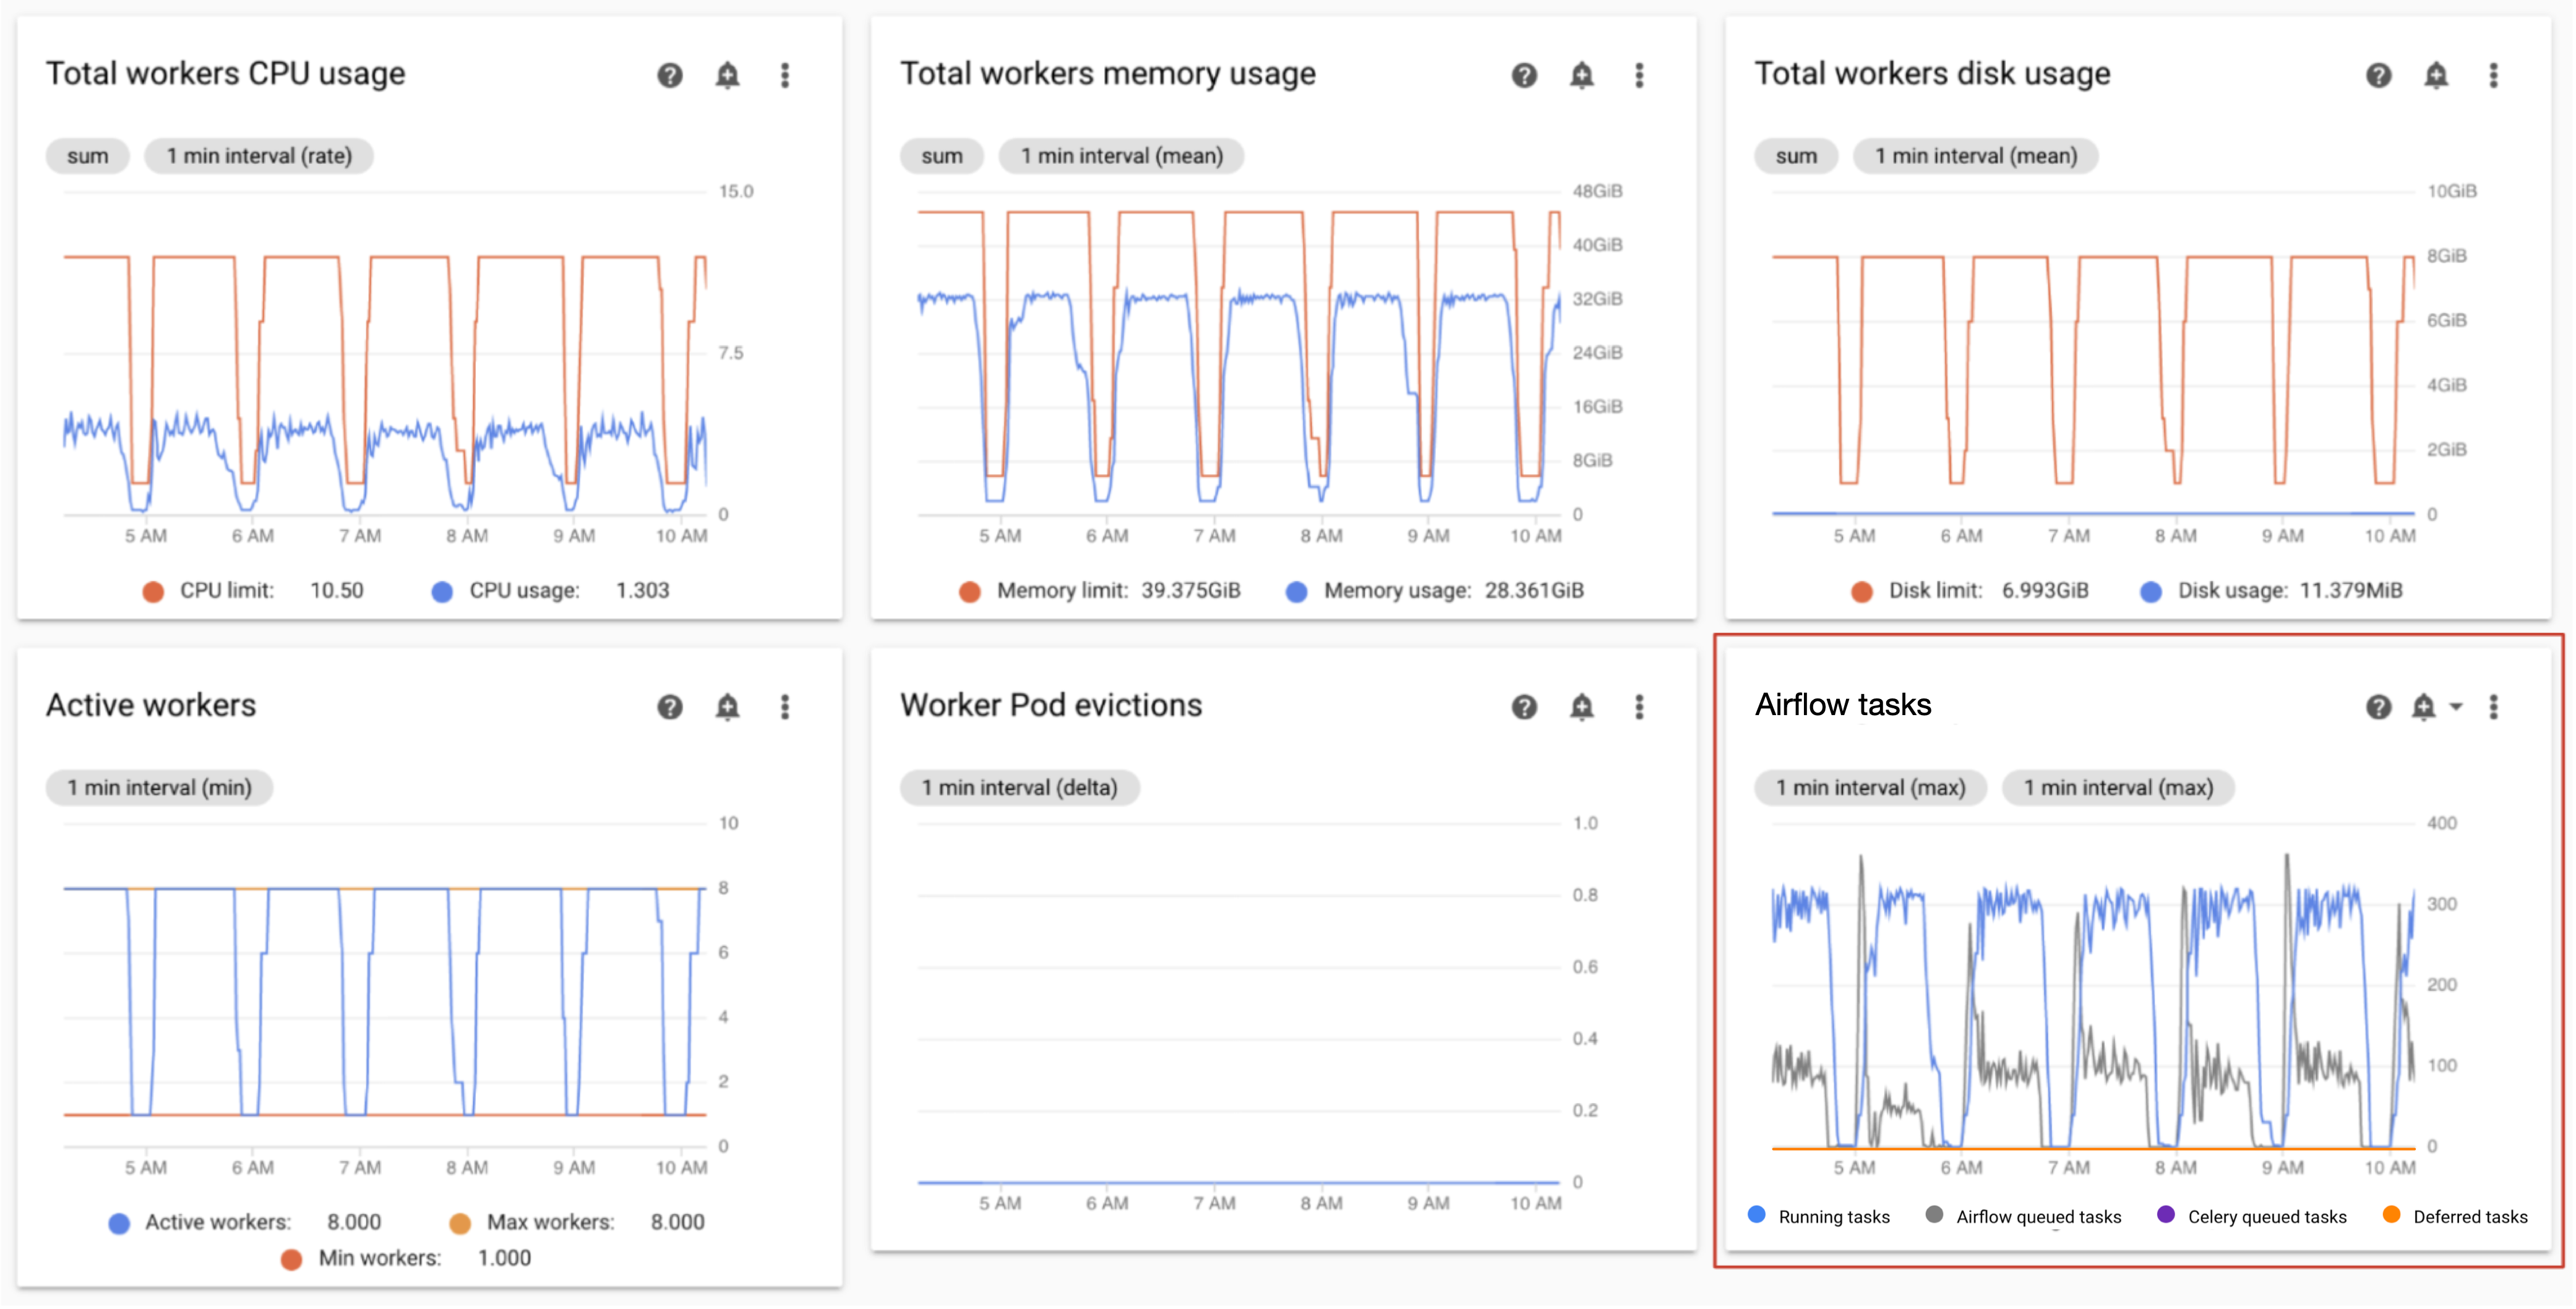
On the Monitoring dashboard, in the Workers section, observe the Airflow tasks graph for your environment.
Tasks in the queue are waiting to be executed by workers. If your environment has queued tasks, this might mean that workers in your environment are busy executing other tasks.
Some queuing is always present in an environment, especially during processing peaks. However, if you observe a high number of queued tasks, or a growing trend in the graph, then this might indicate that workers do not have enough capacity to process the tasks, or that Airflow is throttling task execution.
A high number of queued tasks is typically observed when the number of running tasks also reaches the maximum level.
To address both problems:
Monitor the database CPU and memory usage
Airflow database performance issues can lead to overall DAG execution issues. Database disk usage is typically not a cause for concern because the storage is automatically extended as needed.
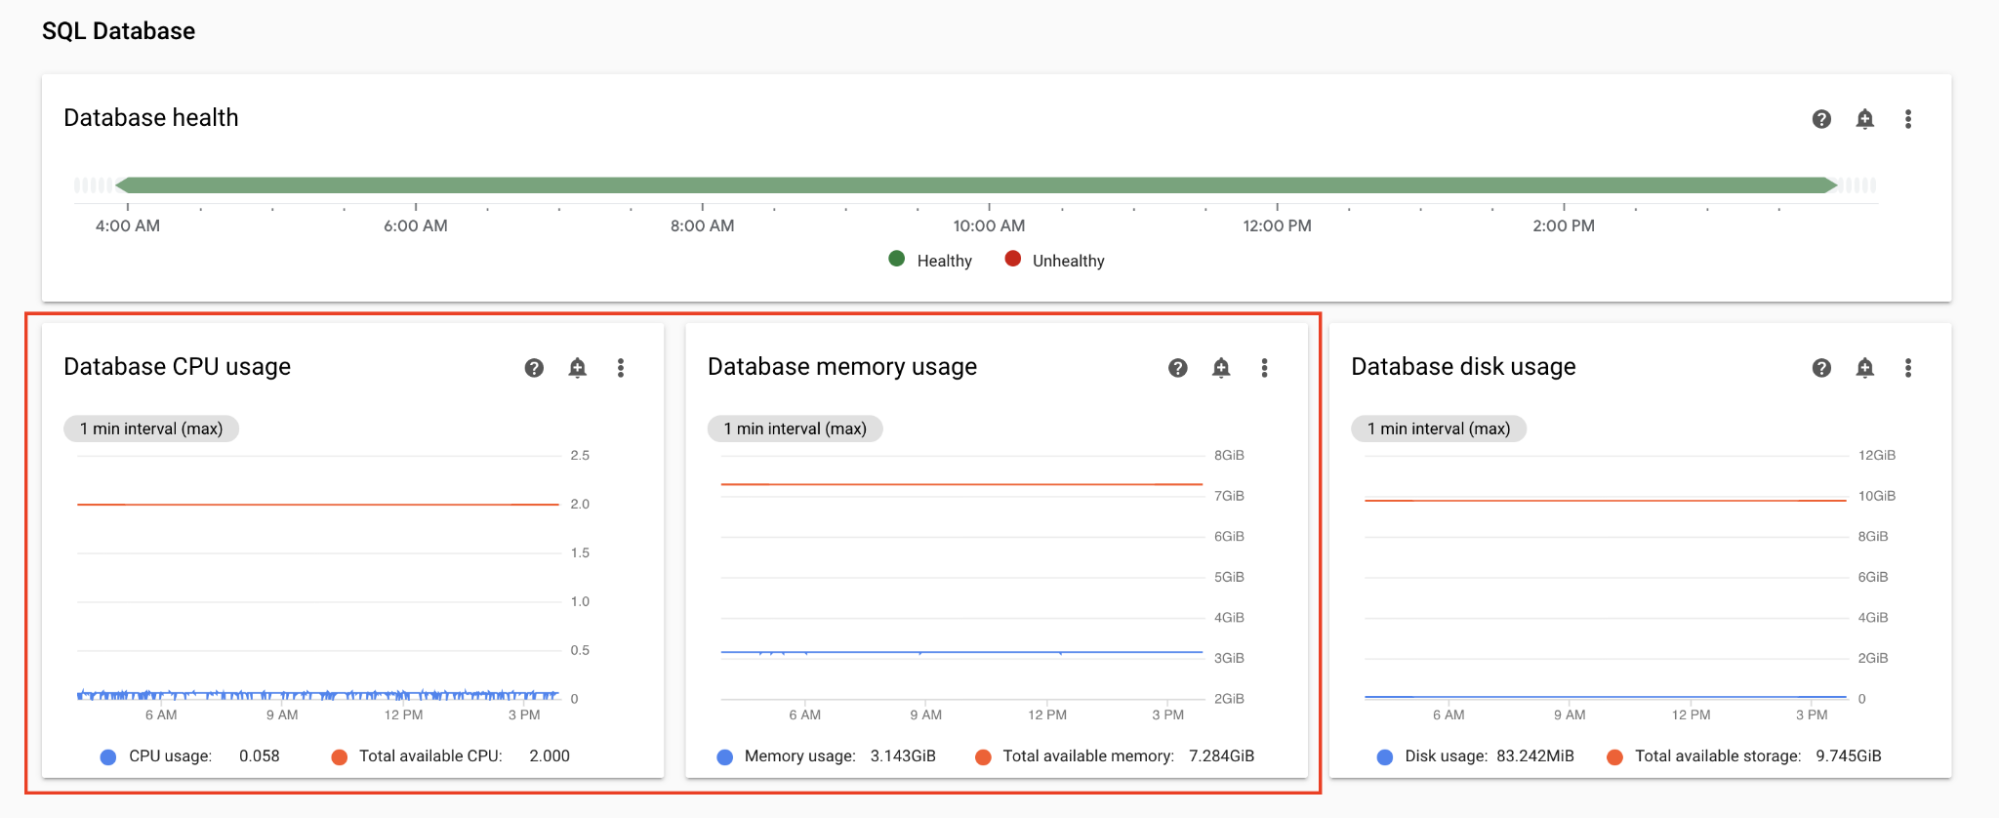
On the Monitoring dashboard, in the SQL Database section, observe graphs for the CPU and memory usage by the Airflow database:
- Database CPU usage
- Database memory usage
If the database CPU usage exceeds 80% for more than a few percent of the total time, the database is overloaded and requires scaling.
Database size settings are controlled by the environment size property of your environment. To scale the database up or down, change the environment size to a different tier (Small, Medium, or Large). Increasing the environment size increases the costs of your environment.
Monitor the task scheduling latency
If the latency between tasks exceeds the expected levels (for example, 20 seconds or more), then this might indicate that the environment cannot handle the load of tasks generated by DAG runs.
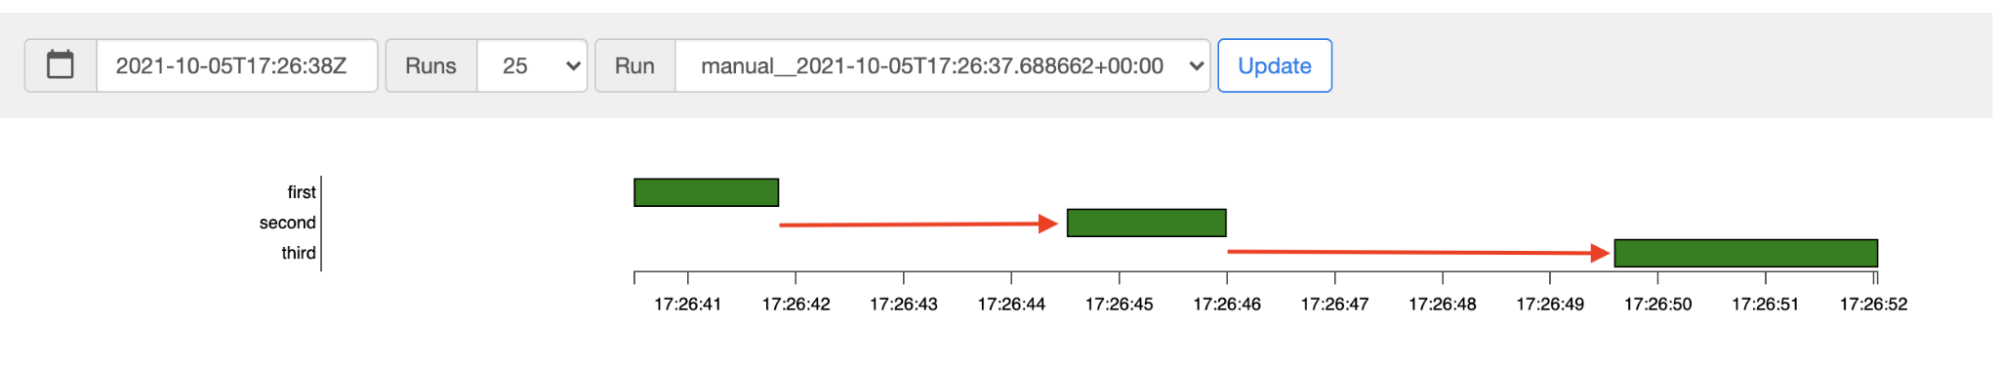
You can view the task scheduling latency graph, in the Airflow UI of your environment.
In this example, delays (2.5 and 3.5 seconds) are well within the acceptable limits but significantly higher latencies might indicate that:
- The scheduler is overloaded. Monitor scheduler CPU and memory for signs of potential problems.
- Airflow configuration options are throttling execution. Try increasing worker concurrency, increasing DAG concurrency or increasing max active runs per DAG.
- There are not enough workers to run tasks, try increasing max number of workers.
Monitor web server CPU and memory
The Airflow web server performance affects Airflow UI. It is not common for the web server to be overloaded. If this happens, the Airflow UI performance might deteriorate, but this does not affect the performance of DAG runs.
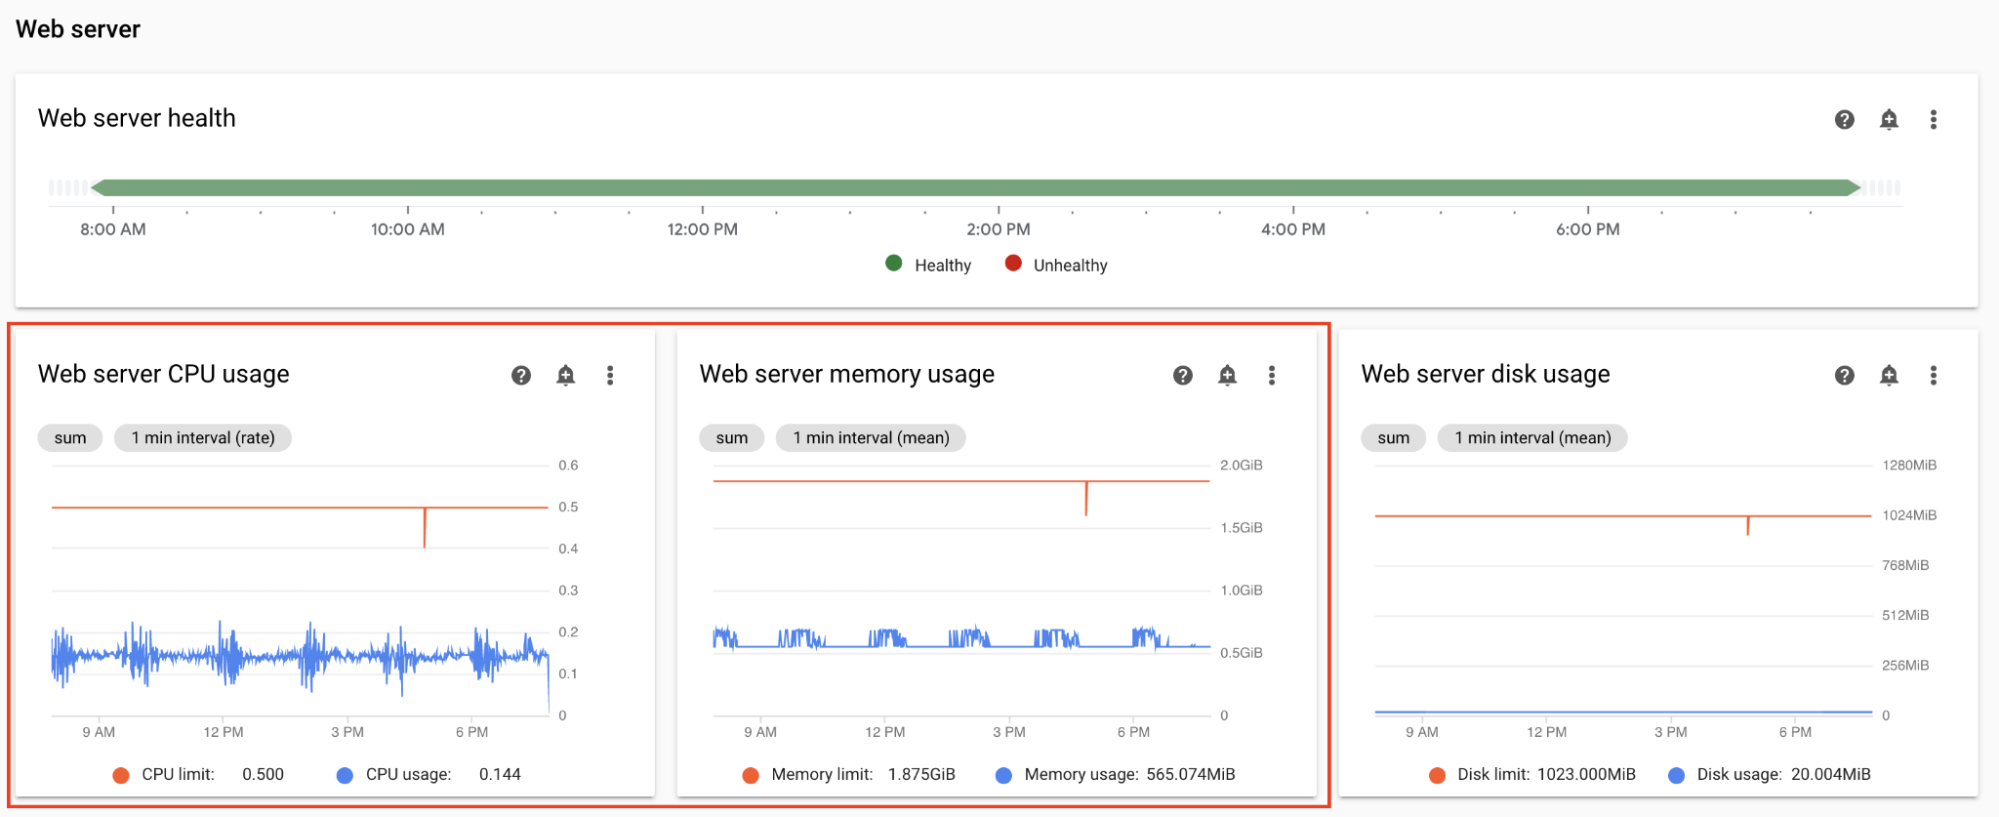
On the Monitoring dashboard, in the Web server section, observe graphs for the Airflow web server:
- Web server CPU usage
- Web server memory usage
Based on your observations:
- If the web server CPU usage is above 80% for more than a few percent of time, consider increasing Web Server CPU.
- If you observe high web server memory usage, consider adding more memory to the web server.
Adjust environment's scale and performance parameters
Change the number of schedulers
Adjusting the number of schedulers improves the scheduler capacity and resilience of Airflow scheduling.
If you increase the number of schedulers, this increases the traffic to and from the Airflow database. We recommend using two Airflow schedulers in most scenarios. Using three schedulers is required only in rare cases that require special considerations. Configuring more than three schedulers frequently leads to lower environment's performance.
If you need faster scheduling:
- Configure two Airflow schedulers.
- Assign more CPU and memory resources to Airflow schedulers.
- Increase dag-dir-list-interval
- Increase min-file-process-interval
- Increase job-heartbeat-sec
Examples:
Console
Follow the steps in Adjust the number of schedulers to set the required number of schedulers for your environment.
gcloud
Follow the steps in Adjust the number of schedulers to set the required number of schedulers for your environment.
The following example sets the number of schedulers to two:
gcloud composer environments update example-environment \
    --scheduler-count=2
Terraform
Follow the steps in Adjust the number of schedulers to set the required number of schedulers for your environment.
The following example sets the number of schedulers to two:
resource "google_composer_environment" "example-environment" {

  # Other environment parameters

  config {
    workloads_config {
      scheduler {
        count = 2
      }
    }
  }
}
Changing the CPU and memory for schedulers
The CPU and memory parameters are for each scheduler in your environment. For example, if your environment has two schedulers, the total capacity is twice the specified number of CPU and memory.
Console
Follow the steps in Adjust worker, scheduler, and web server scale and performance parameters to set CPU and memory for schedulers.
gcloud
Follow the steps in Adjust worker, scheduler, and web server scale and performance parameters to set CPU and Memory for schedulers.
The following example changes the CPU and memory for schedulers. You can specify only CPU or Memory attributes, depending on the need.
gcloud composer environments update example-environment \
  --scheduler-cpu=0.5 \
  --scheduler-memory=3.75
Terraform
Follow the steps in Adjust worker, scheduler, and web server scale and performance parameters to set CPU and memory for schedulers.
The following example changes the CPU and memory for schedulers. You can omit CPU or Memory attributes, depending on the need.
resource "google_composer_environment" "example-environment" {

  # Other environment parameters

  config {
    workloads_config {
      scheduler {
        cpu = "0.5"
        memory_gb = "3.75"
      }
    }
  }
}
Change the maximum number of workers
Increasing the maximum number of workers allows your environment to automatically scale to a higher number of workers, if needed.
Decreasing the maximum number of workers reduces the maximum capacity of the environment but might also be helpful to reduce the environment costs.
Examples:
Console
Follow the steps in Adjust the minimum and maximum number of workers to set the required maximum number of workers for your environment.
gcloud
Follow the steps in Adjust the minimum and maximum number of workers to set the required maximum number of workers for your environment.
The following example sets the maximum number of workers to six:
gcloud composer environments update example-environment \
    --max-workers=6
Terraform
Follow the steps in Adjust the minimum and maximum number of workers to set the required maximum number of workers for your environment.
The following example sets the maximum number of schedulers to six:
resource "google_composer_environment" "example-environment" {

  # Other environment parameters

  config {
    workloads_config {
      worker {
        max_count = "6"
      }
    }
  }
}
Change worker CPU and memory
Decreasing worker memory can be helpful when the worker usage graph indicates very low memory utilization.
Increasing worker memory allows workers to handle more tasks concurrently or handle memory-intensive tasks. It might address the problem of worker pod evictions.
Decreasing worker CPU can be helpful when the worker CPU usage graph indicates that the CPU resources are highly overallocated.
Increasing worker CPU allows workers to handle more tasks concurrently and in some cases reduce the time it takes to process these tasks.
Changing worker CPU or memory restarts workers, which might affect running tasks. We recommend to do it when no DAGs are running.
The CPU and memory parameters are for each worker in your environment. For example, if your environment has four workers, the total capacity is four times the specified number of CPU and memory.
Console
Follow the steps in Adjust worker, scheduler, and web server scale and performance parameters to set CPU and memory for workers.
gcloud
Follow the steps in Adjust worker, scheduler, and web server scale and performance parameters to set the CPU and memory for workers.
The following example changes the CPU and memory for workers. You can omit the CPU or memory attribute, if required.
gcloud composer environments update example-environment \
  --worker-memory=3.75 \
  --worker-cpu=2
Terraform
Follow the steps in Adjust worker, scheduler, and web server scale and performance parameters to set CPU and memory for workers.
The following example changes the CPU and memory for workers. You can omit the CPU or memory parameter, if required.
resource "google_composer_environment" "example-environment" {

  # Other environment parameters

  config {
    workloads_config {
      worker {
        cpu = "2"
        memory_gb = "3.75"
      }
    }
  }
}
Change web server CPU and memory
Decreasing the web server CPU or memory can be helpful when the web server usage graph indicates that it is continuously underutilized.
Changing web server parameters restarts the web server, which causes a temporary web server downtime. We recommend you to make changes outside of the regular usage hours.
Console
Follow the steps in Adjust worker, scheduler, and web server scale and performance parameters to set CPU and memory for the web server.
gcloud
Follow the steps in Adjust worker, scheduler, and web server scale and performance parameters to set the CPU and Memory for the web server.
The following example changes the CPU and memory for the web server. You can omit CPU or memory attributes, depending on the need.
gcloud composer environments update example-environment \
    --web-server-cpu=2 \
    --web-server-memory=3.75
Terraform
Follow the steps in Adjust worker, scheduler, and web server scale and performance parameters to set CPU and memory for the web server.
The following example changes the CPU and memory for the web server. You can omit CPU or memory attributes, depending on the need.
resource "google_composer_environment" "example-environment" {

  # Other environment parameters

  config {
    workloads_config {
      web_server {
        cpu = "2"
        memory_gb = "3.75"
      }
    }
  }
}
Change the environment size
Changing the environment size modifies the capacity of Cloud Composer backend components, such as the Airflow database and the Airflow queue.
- Consider changing the environment size to a smaller size (for example, Large to Medium, or Medium to Small) when Database usage metrics show substantial underutilization.
Consider increasing the environment size if you observe the high usage of the Airflow database.
Console
Follow the steps in Adjust the environment size to set the environment size.
gcloud
Follow the steps in Adjust the environment size to set the environment size.
The following example changes the size of the environment to Medium.
gcloud composer environments update example-environment \
    --environment-size=medium
Terraform
Follow the steps in Adjust the environment size to set the environment size.
The following example changes the size of the environment to Medium.
resource "google_composer_environment" "example-environment" {

  # Other environment parameters

  config {
    environment_size = "medium"
  }
}
Changing the DAG directory listing interval
Increasing the DAG directory listing interval reduces the scheduler load associated with discovery of new DAGs in the environment's bucket.
- Consider increasing this interval if you deploy new DAGs infrequently.
- Consider decreasing this interval if you want Airflow to react faster to newly deployed DAG files.
To change this parameter, override the following Airflow configuration option:
| Section | Key | Value | Notes |
|---|---|---|---|
scheduler |
dag_dir_list_interval |
New value for the listing interval | The default value, in seconds, is 120. |
Changing the DAG file parsing interval
Increasing the DAG file parsing interval reduces the scheduler load associated with the continuous parsing of DAGs in the DAG bag.
Consider increasing this interval when you have a high number of DAGs that do not change too often, or observe a high scheduler load in general.
To change this parameter, override the following Airflow configuration option:
| Section | Key | Value | Notes |
|---|---|---|---|
scheduler |
min_file_process_interval |
New value for the DAG parsing interval | The default value, in seconds, is 30. |
Worker concurrency
Concurrency performance and your environment's ability to autoscale is connected to two settings:
- the minimum number of Airflow workers
- the
[celery]worker_concurrencyparameter
The default values provided by Cloud Composer are optimal for the majority of use cases, but your environment might benefit from custom adjustments.
Worker concurrency performance considerations
The [celery]worker_concurrency parameter defines the number of tasks
a single worker can pick up from the task queue.
Task execution speed depends on multiple factors, such as worker CPU, memory,
and the type of work itself.
Worker autoscaling
Cloud Composer monitors the task queue and spawns additional workers to
pick up any waiting tasks. Setting [celery]worker_concurrency to a high value
means that every worker can pick up a lot of tasks, so under certain circumstances
the queue might never fill up, causing autoscaling to never trigger.
For example, in a Cloud Composer environment with two Airflow workers,
[celery]worker_concurrency set to 100, and tasks 200 in the queue,
each worker would pick up 100 tasks. This leaves the queue empty and doesn't trigger autoscaling. If these tasks take a long time to complete, this could lead to performance issues.
But if the tasks are small and quick to execute, a high value in the
[celery]worker_concurrency setting could lead to overeager scaling.
For example, if that environment has 300 tasks in the queue,
Cloud Composer begins to create new workers. But if the first
200 tasks finish execution by the time the new workers are ready, an existing worker
can pick them up. The end result is that autoscaling creates new workers, but
there are no tasks for them.
Adjusting [celery]worker_concurrency for special cases should be based
on your peak task execution times and queue numbers:
- For tasks that take longer to complete, workers shouldn't be able to empty the queue completely.
- For quicker, smaller tasks, increase the minimum number of Airflow workers to avoid overeager scaling.
Synchronization of task logs
Airflow workers feature a component that synchronizes task execution logs to Cloud Storage buckets. A high number of concurrent tasks performed by a single worker leads to a high number of synchronization requests. This could possibly overload your worker and lead to performance issues.
If you observe performance issues due to high numbers of log synchronization
traffic, lower the [celery]worker_concurrency values and instead adjust
the minimum number of Airflow workers.
Change worker concurrency
Changing this parameter adjusts the number of tasks that a single worker can execute at the same time.
For example, a Worker with 0.5 CPU can typically handle 6 concurrent tasks; an environment with three such workers can handle up to 18 concurrent tasks.
Increase this parameter when there are tasks waiting in the queue, and your workers use a low percentage of their CPUs and memory at the same time.
Decrease this parameter when you are getting pod evictions; this would reduce the number of tasks that a single worker attempts to process. As an alternative, you can increase worker memory.
By default, the worker concurrency is set based on the number of lightweight concurrent task instances that a worker can accommodate. This means that its value is dependent on worker resource limits. The worker concurrency value doesn't depend on the number of workers in your environment.
To change this parameter, override the following Airflow configuration option:
| Section | Key | Value |
|---|---|---|
celery |
worker_concurrency |
New value for worker concurrency |
Change DAG concurrency
DAG concurrency defines the maximum number of task instances allowed to run concurrently in each DAG. Increase it when your DAGs run a high number of concurrent tasks. If this setting is low, the scheduler delays putting more tasks into the queue, which also reduces the efficiency of environment autoscaling.
To change this parameter, override the following Airflow configuration option:
| Section | Key | Value | Notes |
|---|---|---|---|
core |
max_active_tasks_per_dag |
New value for DAG concurrency | The default value is 16 |
Increase max active runs per DAG
This attribute defines the maximum number of active DAG runs per DAG. When the same DAG must be run multiple times concurrently, for example, with different input arguments, this attribute allows the scheduler to start such runs in parallel.
To change this parameter, override the following Airflow configuration option:
| Section | Key | Value | Notes |
|---|---|---|---|
core |
max_active_runs_per_dag |
New value for max active runs per DAG | The default value is 25 |
What's next
- Scale environments
- About environment scaling
- Override Airflow configurations
- Monitor environment health and performance with key metrics