Cloud Composer 3 | Cloud Composer 2 | Cloud Composer 1
This tutorial provides steps to debug a failed Airflow DAG in Cloud Composer and diagnose worker resource-related issues, such as lack of worker memory or storage space, with the help of logs and environment monitoring.
Introduction
This tutorial focuses on resource-related issues to demonstrate ways to debug a DAG.
Lack of allocated worker resources causes DAG failures. If an Airflow task runs out of memory or storage, you might see an Airflow exception, such as:
WARNING airflow.exceptions.AirflowException: Task received SIGTERM signal
INFO - Marking task as FAILED.
or
Task exited with return code Negsignal.SIGKILL
In such cases, the general recommendation is to increase the Airflow worker resources or reduce the number of tasks per worker. However, because Airflow exceptions can be generic, it might be challenging to identify the particular resource that is causing the problem.
This tutorial explains how you can diagnose the reason for a DAG failure and identify the type of resource that causes issues by debugging two example DAGs that fail because of a lack of worker memory and storage.
Objectives
Run example DAGs that fail because of the following reasons:
- Lack of worker memory
- Lack of worker storage
Diagnose the reasons of the failure
Increase the allocated worker resources
Test the DAGs with new resource limits
Costs
This tutorial uses the following billable components of Google Cloud:
When you finish this tutorial, you can avoid continued billing by deleting the resources you created. For more details, see Clean up.
Before you begin
This section describes actions that are required before you start the tutorial.
Create and configure a project
For this tutorial, you need a Google Cloud project. Configure the project in the following way:
In the Google Cloud console, select or create a project:
Make sure that billing is enabled for your project. Learn how to check if billing is enabled on a project.
Make sure that your Google Cloud project user has the following roles to create the necessary resources:
- Environment and Storage Object Administrator
(
roles/composer.environmentAndStorageObjectAdmin) - Compute Admin (
roles/compute.admin) - Monitoring Editor (
roles/monitoring.editor)
- Environment and Storage Object Administrator
(
Enable APIs for your project
Enable the Cloud Composer API.
Roles required to enable APIs
To enable APIs, you need the Service Usage Admin IAM
role (roles/serviceusage.serviceUsageAdmin), which
contains the serviceusage.services.enable permission. Learn how to grant
roles.
Create your Cloud Composer environment
Create a Cloud Composer 2 environment.
As a part of creating the environment,
you grant the Cloud Composer v2 API Service Agent Extension
(roles/composer.ServiceAgentV2Ext) role to the Composer Service Agent
account. Cloud Composer uses this account to perform operations
in your Google Cloud project.
Check worker resource limits
Check the Airflow worker resource limits in your environment:
In the Google Cloud console, go to the Environments page.
In the list of environments, click the name of your environment. The Environment details page opens.
Go to the Environment configuration tab.
Go to Resources > Workloads configuration > Worker.
Check that the values are 0.5 vCPUs, 1.875 GB memory, and 1 GB storage. These are the Airflow worker resource limits that you work with in the next steps of this tutorial.
Example: Diagnose out-of-memory issues
Upload the following sample DAG to the environment
that you created in the previous steps. In this tutorial, this DAG is named
create_list_with_many_strings.
This DAG contains one task that executes the following steps:
- Creates an empty list
s. - Runs a cycle to append the
Morestring to the list. - Prints how much memory the list consumes and waits 1 second in each 1 minute iteration.
import time

import airflow
from airflow import DAG
from airflow.operators.python_operator import PythonOperator
import sys
from datetime import timedelta

default_args = {
    'start_date': airflow.utils.dates.days_ago(0),
    'retries': 0,
    'retry_delay': timedelta(minutes=10)
}

dag = DAG(
    'create_list_with_many_strings',
    default_args=default_args,
    schedule=None)


def consume():
    s = []
    for i in range(120):
        for j in range(1000000):
            s.append("More")
        print(f"i={i}; size={sys.getsizeof(s) / (1000**3)}GB")
        time.sleep(1)


t1 = PythonOperator(
    task_id='task0',
    python_callable=consume,
    dag=dag,
    depends_on_past=False,
    retries=0
)
Trigger the sample DAG
Trigger the sample DAG, create_list_with_many_strings:
In the Google Cloud console, go to the Environments page.
In the Airflow webserver column, follow the Airflow link for your environment.
In the Airflow web interface, on the DAGs page, in the Links column for your DAG, click the Trigger Dag button.
Click Trigger.
On the DAGs page, click the task you triggered and review the output logs to make sure your DAG started running.
While the task is running, the output logs will print the memory size in GB that the DAG is using.
After several minutes, the task will fail because it exceeds the Airflow worker memory limit of 1.875 GB.
Diagnose the failed DAG
If you were running multiple tasks at the time of the failure, consider running only one task and diagnosing resource pressure during that time to identify which tasks cause resource pressure and which resources you need to increase.
Review the Airflow task logs
Observe that the task from the create_list_with_many_strings DAG has a
Failed state.
Review the task's logs. You will see the following log entry:
```none
{local_task_job.py:102} INFO - Task exited with return code
Negsignal.SIGKILL
```

`Netsignal.SIGKILL` might be an indication of your task using more memory
than the Airflow worker is allocated. The system sends
the `Negsignal.SIGKILL` signal to avoid further memory consumption.
Review workloads
Review workloads to check that your task's load does not cause the node where the Pod runs to exceed the memory consumption limit:
In the Google Cloud console, go to the Environments page.
In the list of environments, click the name of your environment. The Environment details page opens.
Go to the Environment configuration tab.
In Resources > GKE cluster > Workloads, click view cluster workloads.
Check if some of the workload pods have statuses similar to the following:
Error with exit code 137 and 1 more issue.
ContainerStatusUnknown with exit code 137 and 1 more issue
Exit code 137means a container or Pod is trying to use more memory than allowed. The process gets terminated to prevent memory usage.
Review the environment health and resource consumption monitoring
Review the environment health and resource consumption monitoring:
In the Google Cloud console, go to the Environments page.
In the list of environments, click the name of your environment. The Environment details page opens.
Go to the Monitoring tab and select Overview.
On the Environment overview panel, locate the Environment Health (Airflow Monitoring DAG) graph. It contains a red area, which corresponds to the time when logs started printing errors.
Select Workers, and find the Total workers memory usage graph. Observe that the Memory usage line has a spike at the time when the task was running.
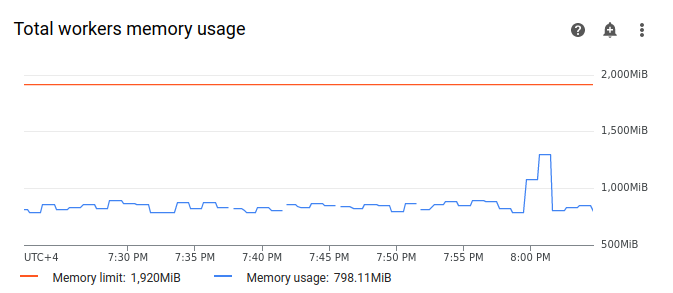
Even though the memory usage line on the graph does not reach the limit, when diagnosing the reasons for failure, you need to take into account memory usage by individual workers. Each worker uses a portion of its memory to run other containers that perform actions necessary for worker's operation, such as syncing its DAG files with the environment's bucket. The actual amount of memory available to a worker to execute Airflow tasks is less than its memory limit. If a worker reaches the limit of the actual memory available to it, the executed task can fail due to insufficient worker memory. In such cases, you can observe task failures even though the line on the total workers memory usage graph doesn't reach the memory limit.
Increase the worker memory limit
Allocate additional worker memory in order for the sample DAG to succeed:
In the Google Cloud console, go to the Environments page.
In the list of environments, click the name of your environment. The Environment details page opens.
Go to the Environment configuration tab.
Find the Resources > Workloads configuration and click Edit.
In the Worker section, in the Memory field, specify the new memory limit for Airflow workers. In this tutorial, use 3 GB.
Save the changes and allow several minutes for your Airflow workers to restart.
Test your DAG with the new memory limit
Trigger the create_list_with_many_strings DAG again and wait until it
finishes running.
In the output logs of your DAG run, you will see
Marking task as SUCCESS, and the task's state will indicate Success.Review the Environment overview section in the Monitoring tab and make sure that there are no red areas.
Click the Workers section and find the Total workers memory usage graph. You will see that the Memory limit line reflects the change in the memory limit, and the Memory usage line is far below the actual allocatable memory limit.
Example: Diagnose out-of-storage issues
In this step, you upload two DAGs that create large files. The first DAG creates a large file. The second DAG creates a large file and imitates a long-running operation.
The size of the file in both DAGs exceeds the default Airflow worker storage limit of 1 GB but the second DAG has an additional wait task to extend its duration artificially.
You will investigate the differences in the behavior of both DAGs in the next steps.
Upload a DAG that creates a large file
Upload the following sample DAG to the environment
that you created in the previous steps. In this tutorial, this DAG is named
create_large_txt_file_print_logs.
This DAG contains one task that executes the following steps:
- Writes a 1.5 GB
localfile.txtfile to the Airflow worker storage. - Prints the size of the created file by using the Python
osmodule. - Prints the duration of the DAG run every 1 minute.
import airflow
from airflow import DAG
from airflow.operators.python_operator import PythonOperator
import os
from datetime import timedelta
import time

default_args = {
    'start_date': airflow.utils.dates.days_ago(0),
    'retries': 0,
    'retry_delay': timedelta(minutes=10)
}

dag = DAG(
    'create_large_txt_file_print_logs',
    default_args=default_args,
    schedule=None)


def consume():
    size = 1000**2  # bytes in 1 MB
    amount = 100

    def create_file():
        print(f"Start creating a huge file")
        with open("localfile.txt", "ab") as f:
            for j in range(15):
                f.write(os.urandom(amount) * size)
        print("localfile.txt size:", os.stat("localfile.txt").st_size / (1000**3), "GB")

    create_file()
    print("Success!")


t1 = PythonOperator(
    task_id='create_huge_file',
    python_callable=consume,
    dag=dag,
    depends_on_past=False,
    retries=0)
Upload a DAG that creates a large file in a long-running operation
To imitate a long-running DAG and investigate the impact of the task duration
on the end state, upload the second sample DAG to your
environment. In this tutorial, this DAG is named
long_running_create_large_txt_file_print_logs.
This DAG contains one task that executes the following steps:
- Writes a 1.5 GB
localfile.txtfile to the Airflow worker storage. - Prints the size of the created file by using the Python
osmodule. - Waits 1 hour 15 minutes to imitate some time needed for operations with the file, for example, reading from the file.
- Prints the duration of the DAG run every 1 minute.
import airflow
from airflow import DAG
from airflow.operators.python_operator import PythonOperator
import os
from datetime import timedelta
import time

default_args = {
    'start_date': airflow.utils.dates.days_ago(0),
    'retries': 0,
    'retry_delay': timedelta(minutes=10)
}

dag = DAG(
    'long_running_create_large_txt_file_print_logs',
    default_args=default_args,
    schedule=None)


def consume():
    size = 1000**2  # bytes in 1 MB
    amount = 100

    def create_file():
        print(f"Start creating a huge file")
        with open("localfile.txt", "ab") as f:
            for j in range(15):
                f.write(os.urandom(amount) * size)
        print("localfile.txt size:", os.stat("localfile.txt").st_size / (1000**3), "GB")

    create_file()
    for k in range(75):
        time.sleep(60)
        print(f"{k+1} minute")

    print("Success!")


t1 = PythonOperator(
    task_id='create_huge_file',
    python_callable=consume,
    dag=dag,
    depends_on_past=False,
    retries=0)
Trigger sample DAGs
Trigger the first DAG, create_large_txt_file_print_logs:
In the Google Cloud console, go to the Environments page.
In the Airflow webserver column, follow the Airflow link for your environment.
In the Airflow web interface, on the DAGs page, in the Links column for your DAG, click the Trigger Dag button.
Click Trigger.
On the DAGs page, click the task you triggered and review the output logs to make sure your DAG started running.
Wait until the task you created with the
create_large_txt_file_print_logsDAG completes. This might take several minutes.On the DAGs page, click the DAG run. You will see your task has a
Successstate, even though the storage limit was exceeded.
Review the task Airflow logs:
In the Google Cloud console, go to the Environments page.
In the list of environments, click the name of your environment. The Environment details page opens.
Go to the Logs tab, then go to All logs > Airflow logs > Workers > View in Logs Explorer.
Filter the logs by type: show only Error messages.
In the logs, you will see messages similar to the following:
Worker: warm shutdown (Main Process)
or
A worker pod was evicted at 2023-12-01T12:30:05Z with message: Pod ephemeral
local storage usage exceeds the total limit of containers 1023Mi.
These logs indicate the pod started the "warm shutdown" process because the used storage exceeded the limit and was evicted in 1 hour. However, the DAG run did not fail because it was completed within the Kubernetes termination grace period, which is explained further in this tutorial.
To illustrate the concept of the termination grace period, review the outcome
of the second sample DAG, long_running_create_large_txt_file_print_logs.
Trigger the second DAG, long_running_create_large_txt_file_print_logs:
In the Google Cloud console, go to the Environments page.
In the Airflow webserver column, follow the Airflow link for your environment.
In the Airflow web interface, on the DAGs page, in the Links column for your DAG, click the Trigger Dag button.
Click Trigger.
On the DAGs page, click the task you triggered and review the output logs to make sure your DAG started running.
Wait until the
long_running_create_large_txt_file_print_logsDAG run fails. This will take about one hour.
Review the DAG run results:
On the DAGs page, click the
long_running_create_large_txt_file_print_logsDAG run. You will see that the task has aFailedstate, and that the duration of the run was exactly 1 hour 5 minutes, which is less than the task's waiting period of 1 hour 15 minutes.Review the task's logs. Once the DAG created the
localfile.txtfile in the Airflow worker's container, the log prints that the DAG started waiting, and the run duration is printed in the task logs every 1 minute. In this example, the DAG prints thelocalfile.txt size:log and the size of thelocalfile.txtfile will be 1.5 GB.
Once the file written to the Airflow worker's container exceeds the storage limit, the DAG run is supposed to fail. However, the task does not fail immediately and keeps running until its duration reaches 1 hour and 5 minutes. This happens because Kubernetes does not kill the task immediately and keeps running to allow 1 hour of time-to-recovery, known as the "termination grace period". Once a node runs out of resources, Kubernetes does not terminate the Pod immediately to handle termination gracefully, so that there is minimal impact on the end user.
The termination grace period helps users to recover files after task failures, however, it can lead to confusion when diagnosing DAGs. When the Airflow worker storage limit is exceeded, the end task state depends on the duration of the DAG run:
If the DAG run exceeds the worker storage limit but completes in less than 1 hour, the task completes with a
Successstatus because it was completed within the termination grace period. However, Kubernetes terminates the Pod and the written file is deleted from the container immediately.If the DAG exceeds the worker storage limit and runs for more than 1 hour, the DAG keeps running for 1 hour and can exceed the storage limit by thousands of percent before Kubernetes eliminates the Pod and Airflow marks the task as
Failed.
Diagnose the failed DAG
If you were running multiple tasks at the time of the failure, consider running only one task and diagnosing resource pressure during that time to identify which tasks cause resource pressure and which resources you need to increase.
Review the task logs of the second DAG,
long_running_create_large_txt_file_print_logs:
In the Google Cloud console, go to the Environments page.
In the list of environments, click the name of your environment. The Environment details page opens.
Go to the Logs tab, then go to All logs > Airflow logs > Workers > View in Logs Explorer.
Filter the logs by type: show only Error messages.
In the logs, you will see messages similar to the following:
Container storage usage of worker reached 155.7% of the limit.

This likely means that the total size of local files generated by your DAGs is
close to the storage limit of worker.

You may need to decrease the storage usage or increase the worker storage limit
in your Cloud Composer environment configuration.
or
Pod storage usage of worker reached 140.2% of the limit.
A worker pod was evicted at 2023-12-01T12:30:05Z with message: Pod ephemeral
local storage usage exceeds the total limit of containers 1023Mi.

This eviction likely means that the total size of dags and plugins folders plus
local files generated by your DAGs exceeds the storage limit of worker.

Please decrease the storage usage or increase the worker storage limit in your
Cloud Composer environment configuration.
These messages indicate that, as the task progressed, Airflow logs started printing errors when the size of the files generated by your DAG exceeded the worker storage limit, and the termination grace period started. During the termination grace period, storage consumption did not return to the limit, which led to Pod eviction after the termination grace period ended.
Review the environment health and resource consumption monitoring:
In the Google Cloud console, go to the Environments page.
In the list of environments, click the name of your environment. The Environment details page opens.
Go to the Monitoring tab and select Overview.
On the Environment overview panel, locate the Environment Health (Airflow Monitoring DAG) graph. It contains a red area, which corresponds to the time when logs started printing errors.
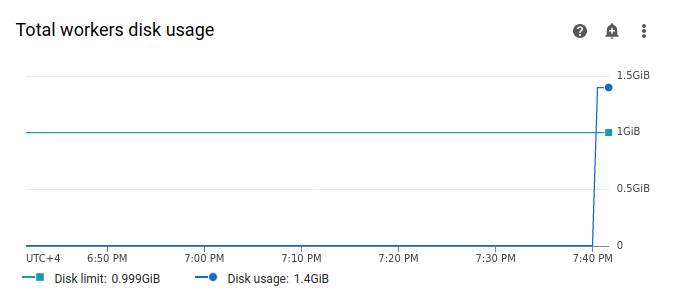
Select Workers, and find the Total workers disk usage graph. Observe that the Disk usage line has a spike and exceeds the Disk limit line at the time when your task was running.
Increase the worker storage limit
Allocate additional Airflow worker storage in order for the sample DAG to succeed:
In the Google Cloud console, go to the Environments page.
In the list of environments, click the name of your environment. The Environment details page opens.
Go to the Environment configuration tab.
Find the Resources > Workloads configuration and click Edit.
In the Worker section, in the Storage field, specify the new storage limit for Airflow workers. In this tutorial, set it to 2 GB.
Save the changes and allow several minutes for your Airflow workers to restart.
Test your DAG with the new storage limit
Trigger the long_running_create_large_txt_file_print_logs DAG again and
wait for 1 hour and 15 minutes until it finishes running.
In the output logs of your DAG run, you will see
Marking task as SUCCESS, and the task's state will indicate Success, with a duration of 1 hour and 15 minutes which is equal to the waiting time set in the DAG code.Review the Environment overview section in the Monitoring tab and make sure that there are no red areas.
Click the Workers section and find the Total workers disk usage graph. You will see that the Disk limit line reflects the change in the storage limit, and the Disk usage line is within the allowed range.
Summary
In this tutorial, you diagnosed the reason for a DAG failure and identified the type of resource that causes pressure by debugging two example DAGs that fail due to a lack of worker memory and storage. You then ran the DAGs successfully after allocating more memory and storage to your workers. However, it is recommended to optimize your DAGs (workflows) to reduce worker resource consumption in the first place, because it is not possible to increase the resources beyond a certain threshold.
Clean up
To avoid incurring charges to your Google Cloud account for the resources used in this tutorial, either delete the project that contains the resources or keep the project and delete the individual resources.
Delete the project
- In the Google Cloud console, go to the Manage resources page.
- In the project list, select the project that you want to delete, and then click Delete.
- In the dialog, type the project ID, and then click Shut down to delete the project.
Delete individual resources
If you plan to explore multiple tutorials and quickstarts, reusing projects can help you avoid exceeding project quota limits.
Delete the Cloud Composer environment. You also delete the environment's bucket during this procedure.