このページでは、Google App Engine でレイテンシの増大をモニタリングしてアラートを受け取る方法について説明します。
App Engine アプリでは、さまざまな理由でレイテンシが大きくなる可能性があります。たとえば、アプリのコードが最適化されていない、リソースが十分にない、ビジー状態のマシンが存在するといった理由が考えられます。このガイドでは、理由にかかわらず App Engine によって生成されるレイテンシに焦点を当てて説明します。
レイテンシの増大は 5xx エラーにつながる可能性が高いことを理解しておくことが重要です。したがって、レイテンシの増大を迅速に検出すれば、早い段階でこれに対処してアプリケーション エラーを解決できます。
モニタリングとアラートの設定
モニタリング
アプリのレスポンスのレイテンシをモニタリングするためにカスタマイズしたグラフを作成する場合は、[Cloud Monitoring] > [Metrics Explorer] を使用して独自のグラフを構築します。
[リソースの種類] で、[GAE アプリケーション] を選択し、[指標] フィルタで [レスポンスのレイテンシ] を選択します。確認する具体的なサービスがある場合は、[フィルタ] を使用して特定のモジュールでフィルタすることもできます。そうすると、そのサービスのレスポンス レイテンシ グラフが表示されます。
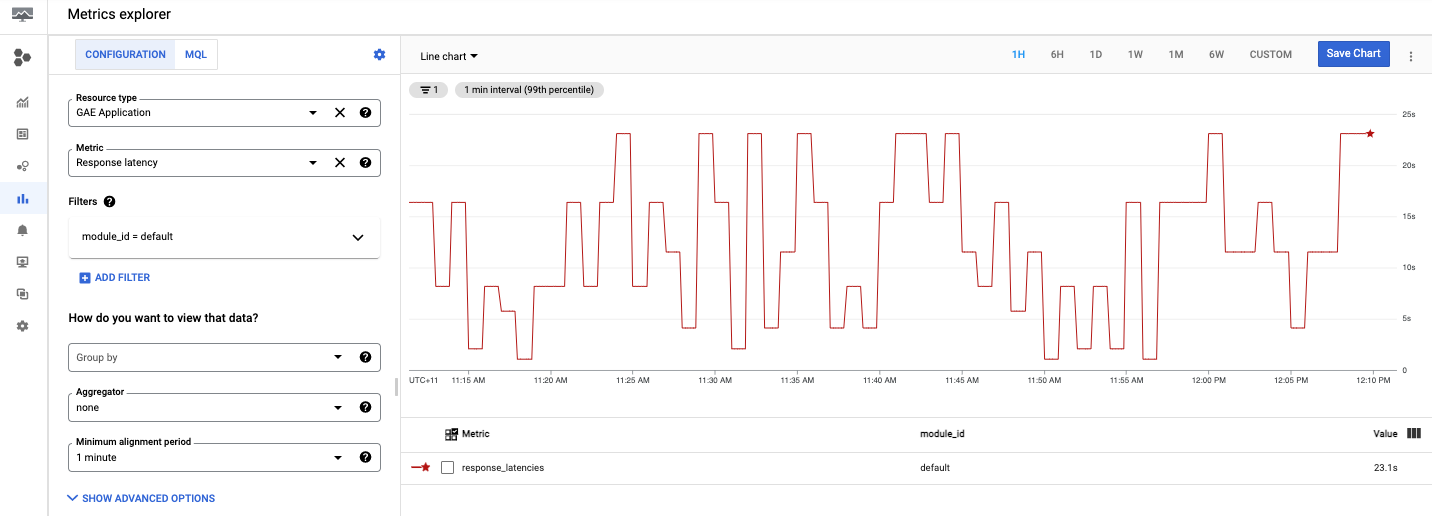
これでカスタマイズしたグラフを設定できたので、次のセクションでは、一定の秒数を超えるレイテンシの通知を設定する方法について説明します。
アラート
アラート ポリシーを作成する方法は次のとおりです。
- 通知を設定し、[Cloud Monitoring] > [アラート] でアラート ポリシーを作成して、[+ CREATE POLICY] をクリックします。
[ADD ALERT CONDITION] をクリックして、アラートに条件を追加します。
ターゲットとして [GAE アプリケーション] を選択します。
たとえば、App Engine アプリの応答時間のようなレスポンスのレイテンシに関するアラートを受け取る場合は、[レスポンスのレイテンシ] を選択します。
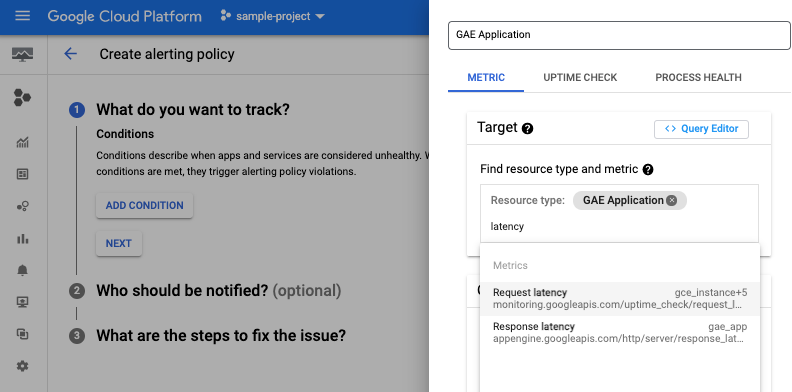
状況に応じてモジュール ID を選択し、しきい値と通知チャンネルを追加することもできます。手順については、通知チャンネルの管理をご覧ください。
ポリシーの作成が終了すると、[アラート] ページの一覧にそのポリシーが表示されます。作成したポリシーをクリックすると、次の図のような詳細が表示されます。
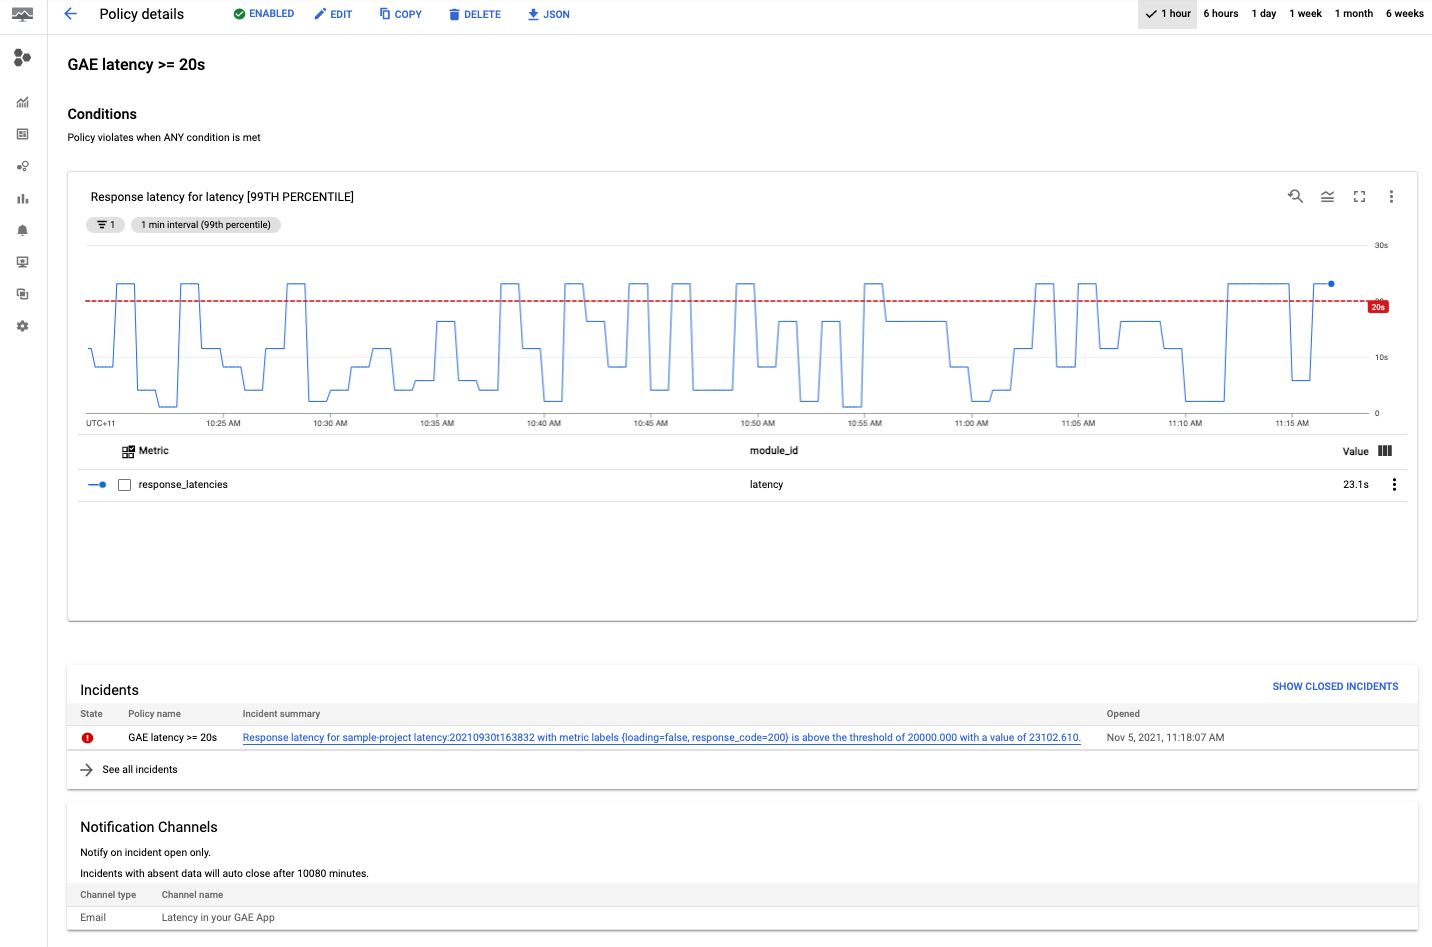
以上で、最初の App Engine レイテンシ ポリシーが作成されました。ポリシーを作成した後は、インシデントが検出されると選択したチャンネルにアプリからアラートが送信されます。
レイテンシのデバッグ
App Engine レイテンシ ダッシュボードの確認
通常、App Engine アプリケーションのレイテンシを確認するには、[App Engine] > [ダッシュボード] に移動して [レイテンシ] グラフを選択します。
レイテンシ グラフをサービス、バージョン、期間でフィルタして、データを詳しく調査できます。
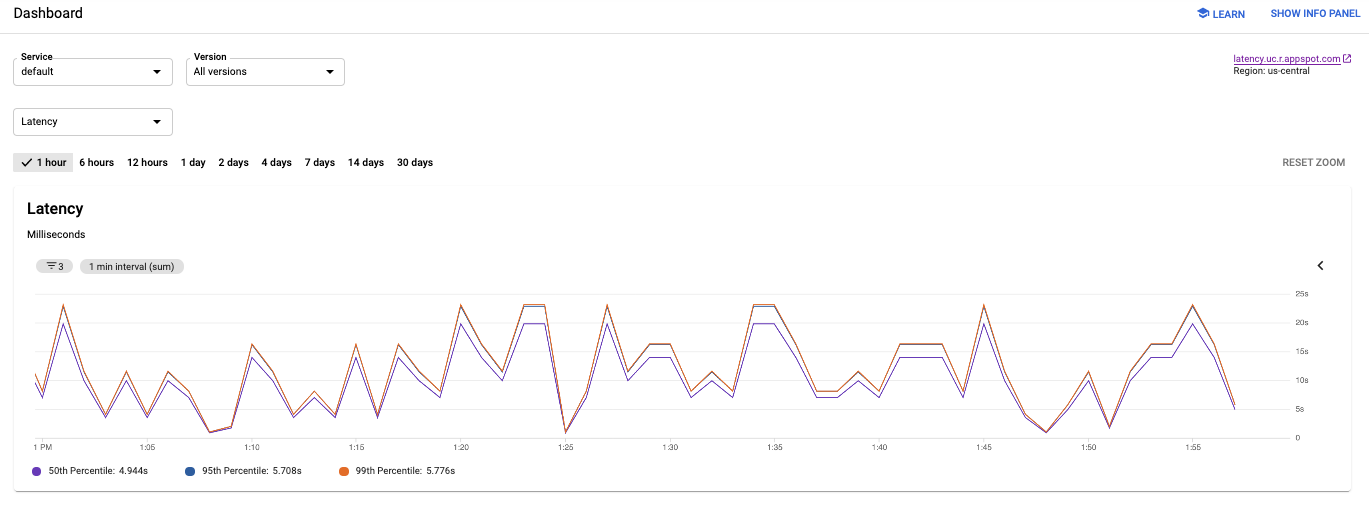
上の図では、アプリケーションのレイテンシが数ミリ秒から 25 秒近くまで変動していることがわかります。
アプリのレイテンシについて
特定のリクエストにかかった時間をすぐに知りたい場合は、次の情報を調べます。
- Cloud Logging に移動して、リクエストログとアプリケーション ログを見ます。
- Cloud Trace に移動して、リクエストがどのように伝播するかを追跡します。
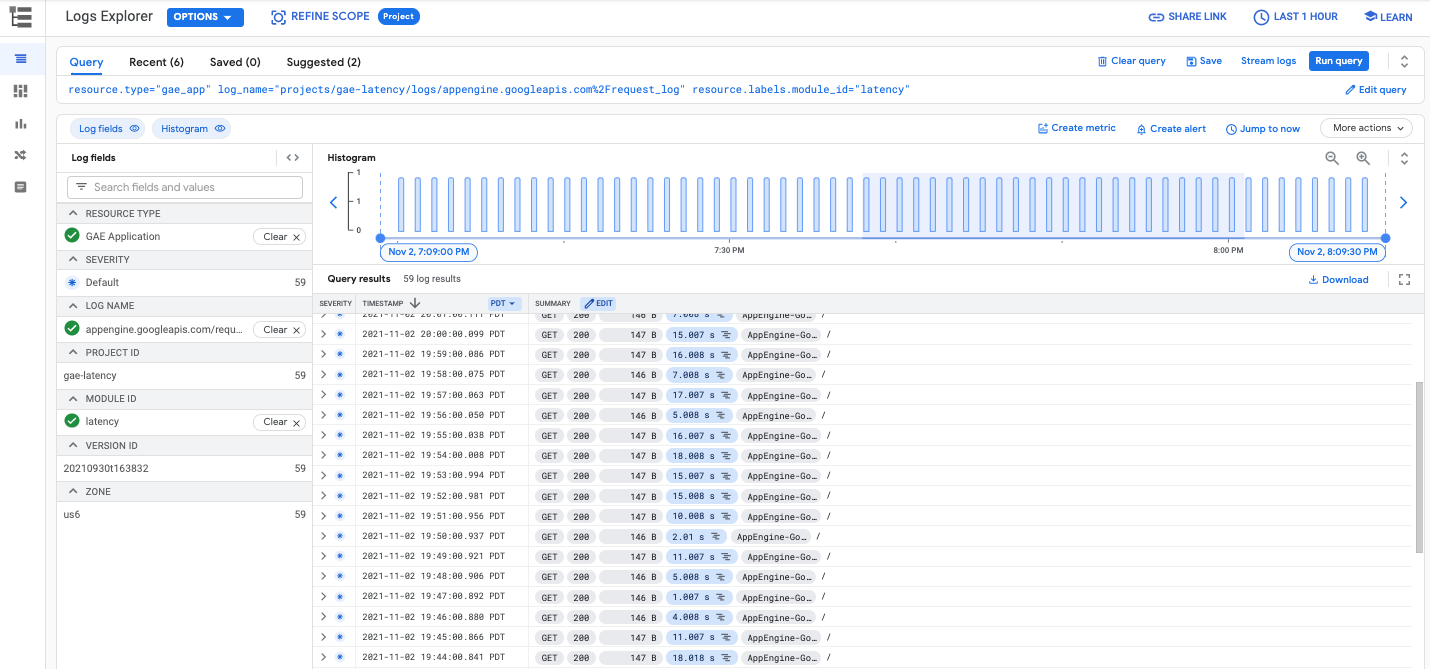
Cloud Logging
Cloud Logging では、リクエストログとアプリケーション ログの 2 種類のログを見ることができます。リクエストログは、アプリケーションへのリクエストごとに App Engine によって自動的に作成されるログで、HTTP メソッドやレスポンス コードなどが含まれます。アプリケーション ログは、ユーザーが書き込むアプリケーションのログです。
リクエストログまたはアプリケーション ログを表示するには、ログの表示をご覧ください。
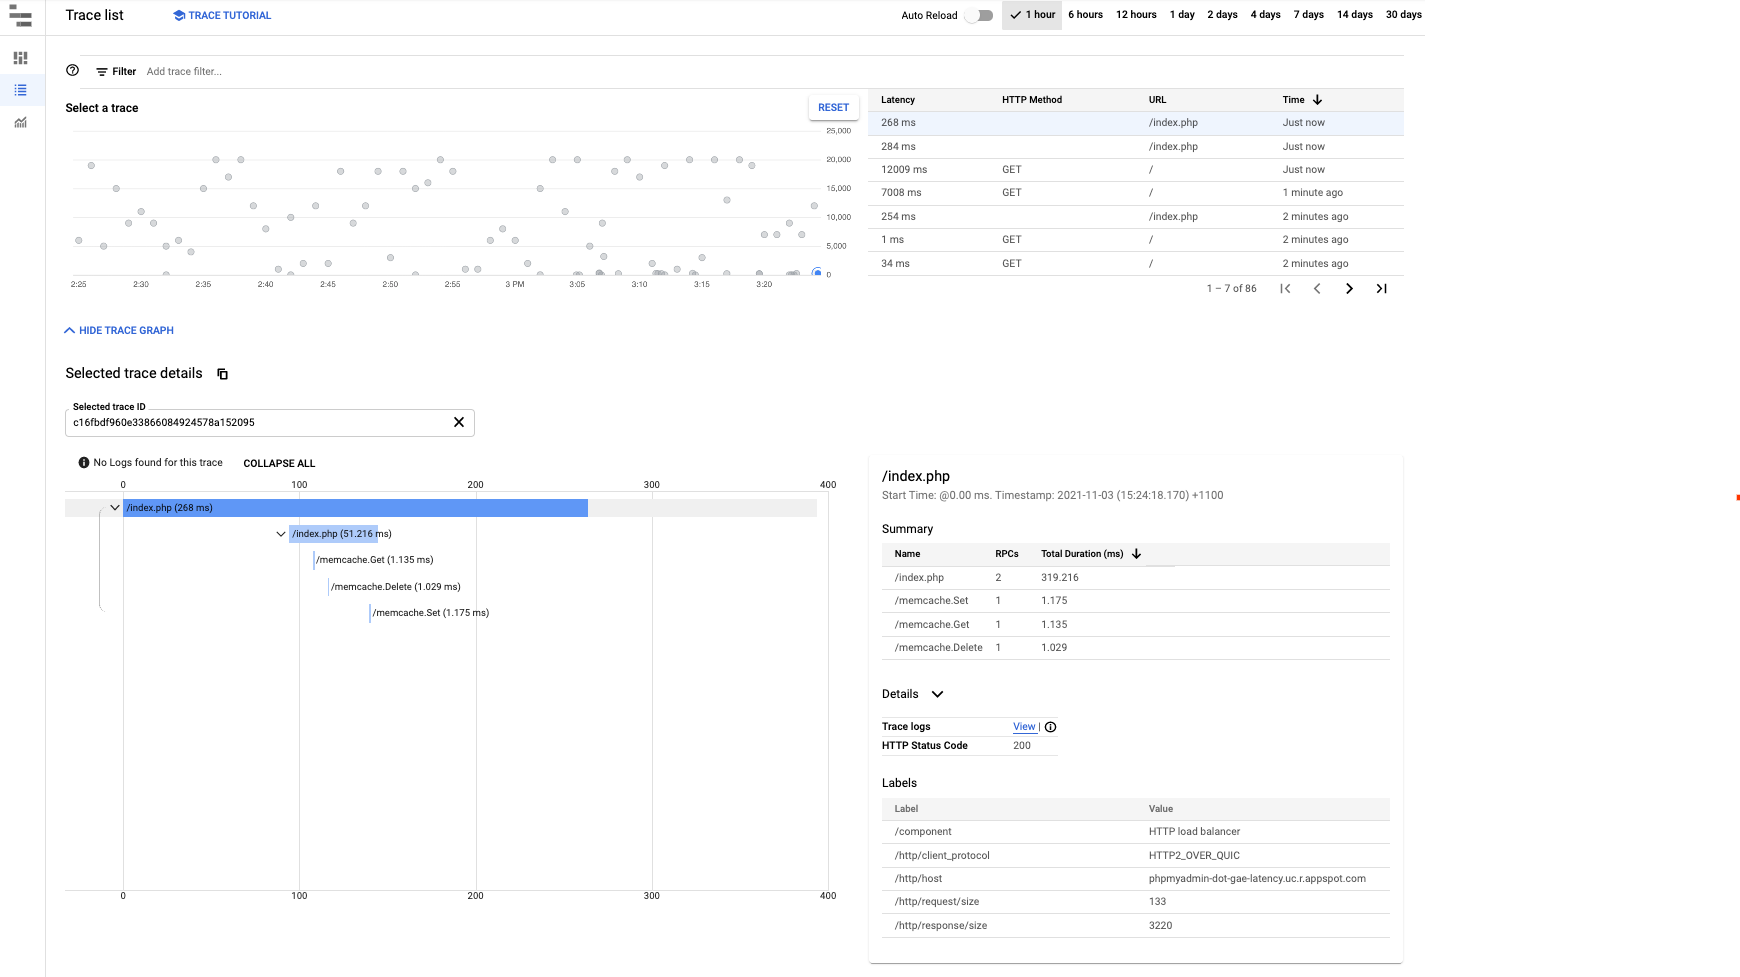
Cloud Trace
Cloud Trace は、リクエストがアプリケーションを通じてどのように伝播するかを把握するために役立ちます。リクエストごとの詳しいレイテンシ情報の分析や、アプリケーション全体のレイテンシの確認などができます。
Cloud Trace でトレースの詳細を表示するには、トレースを検索して調査するの手順を実施します。次の図に示すように、[Trace エクスプローラ] でフィルタを使用して App Engine の特定のサービスやバージョンでトレースをフィルタできます。