You're viewing Apigee and Apigee hybrid documentation.
There is no equivalent
Apigee Edge documentation for this topic.
Symptom
This issue appears as "503 - Service Unavailable" errors in API Monitoring, Debug, or other tools. The "TARGET_CONNECT_TIMEOUT" reason indicates a connection timeout between the Apigee instance and the internet target or a target reachable with VPC Peering.
The error should not be confused with other timeout errors, such as 504 Gateway Timeout.
Error Message
This is the typical error in the Debug session or the response payload. Please note the reason:
TARGET_CONNECT_TIMEOUT.
{"fault":{"faultstring":"The Service is temporarily unavailable",
"detail":{"errorcode":"messaging.adaptors.http.flow.ServiceUnavailable",
"reason":"TARGET_CONNECT_TIMEOUT"}}}
Possible Causes
Note that these causes are specific to internet targets or targets reachable with VPC Peering. See Apigee networking options. If the target is PSC (Endpoint Attachment), see the PSC playbook instead.
| Cause | Description |
|---|---|
| Routes misconfiguration | Target routes are not exported into the peering with Apigee instance. |
| Connectivity issue at target | Target is not always able to accept a TCP connection. |
| IP allow-listing at target with some or all Apigee NAT IPs not added | Not all Apigee NAT IPs are allow-listed at target. |
| NAT IP port exhaustion | Not enough NAT ports accommodated for the traffic. |
| connect.timeout.millis value is set too low | Connection timeout setting is too low on the Apigee side. |
Common Diagnosis Steps
Debug is an essential tool to capture and evaluate the following details about the issue:
- Total duration of the request. Usually it takes three seconds (default connect.timeout.millis) until a connection timeout occurs. If you notice a lower duration, check the Target Endpoint configuration.
- Target hostname and the IP address. The wrong IP address showing might indicate a DNS-related issue. You might also notice a correlation between different target IPs and the issue.
- Frequency. Different approaches are needed depending on whether the issue is intermittent or persistent.
Cause: Route misconfiguration
Diagnosis
If the issue is persistent, even if it started recently, it might be caused by a route misconfiguration.
This could affect both internal (routed within peered VPC) and external (internet) targets.
-
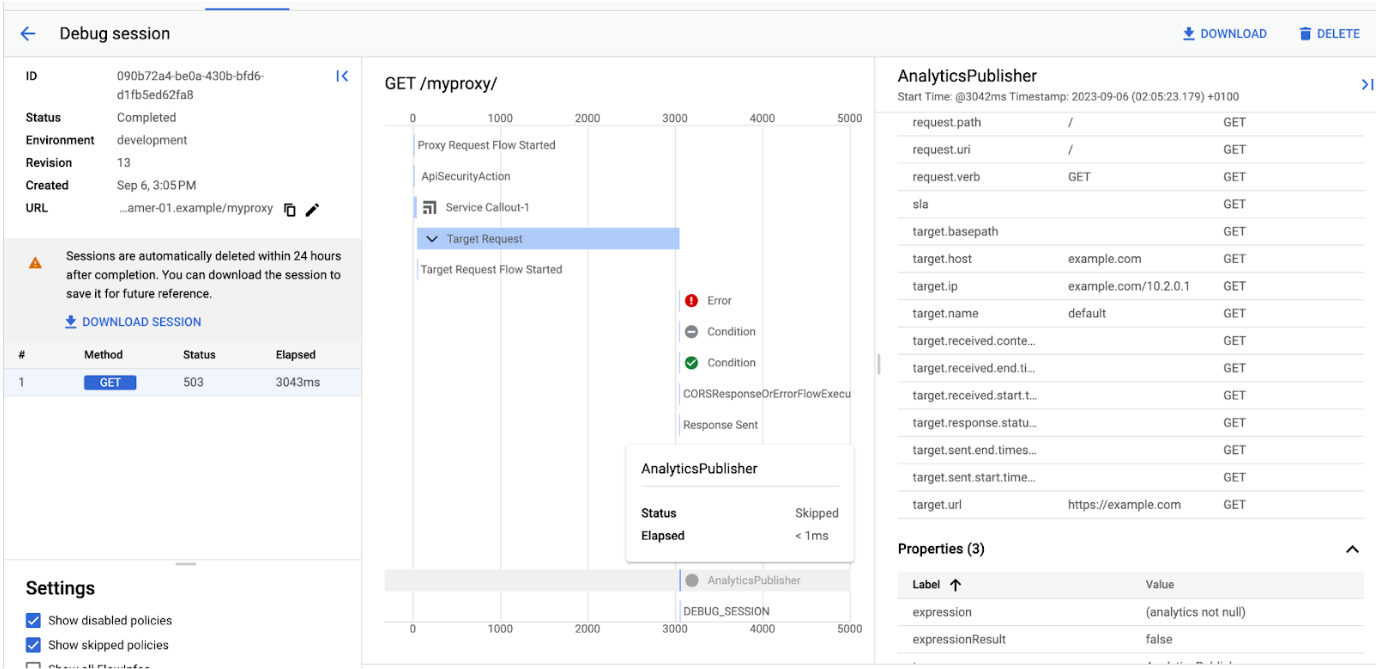
First, identify the IP address of the target resolved from the Apigee instance. One of the methods is to use a Debug session. In Debug, navigate to AnalyticsPublisher (or AX in the Classic Debug):

Look for the target.ip value on the right side of the screen.
In this example, the IP is 10.2.0.1. Since this range is private, it requires certain routing measures to be put in place to ensure Apigee can reach the target.
Please note that if the target is on the internet, you need to follow this step if VPC Service Controls are enabled for Apigee, since that prevents internet connectivity.
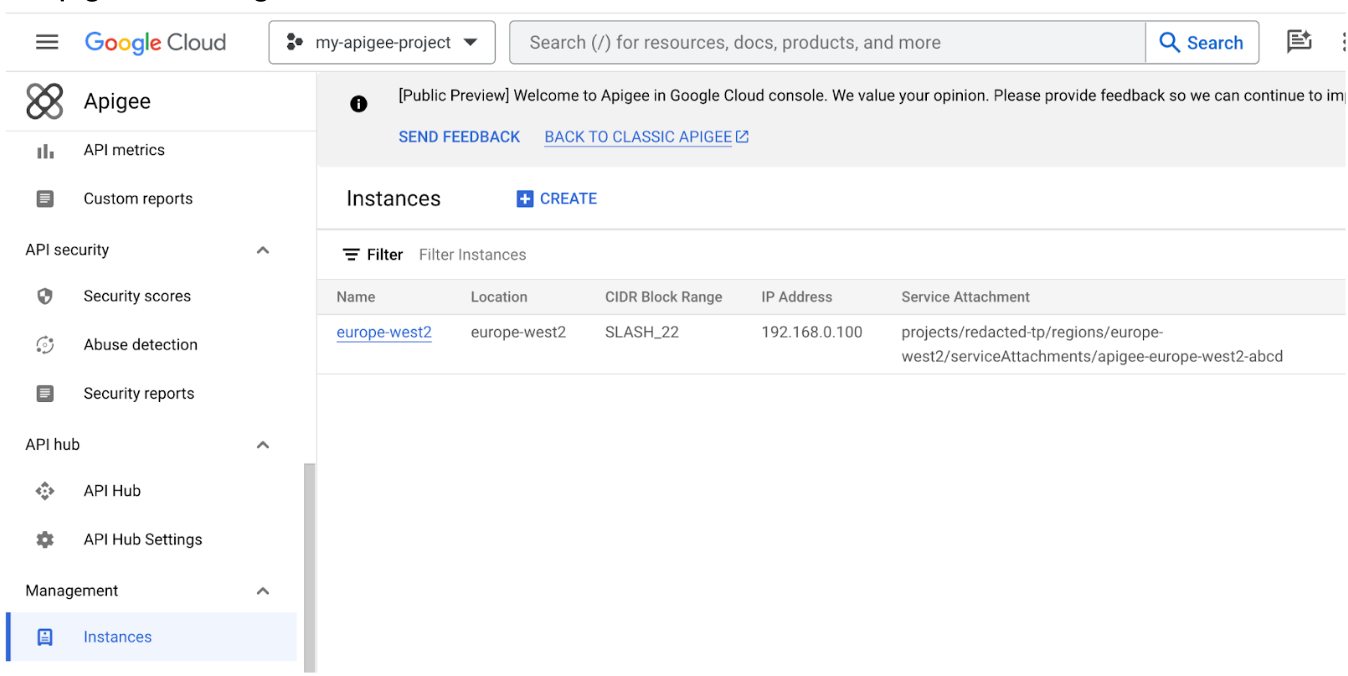
- Note the region where the affected Apigee instance is deployed. In the
Apigee UI in Cloud console, click Instances. In the Location field, you can
find the exact region of the instance.
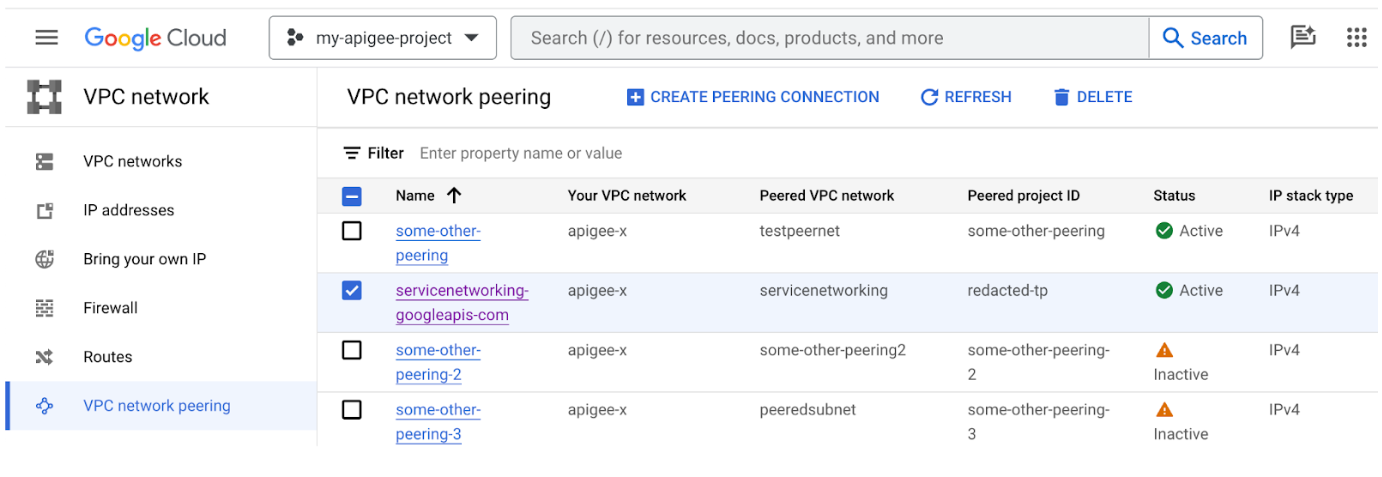
- In the project that is peered with Apigee, navigate to the VPC Network -> VPC
network peering section in the UI. Please note, if you are using
Shared VPC, then
those steps need to be performed in the host project instead of the Apigee project.
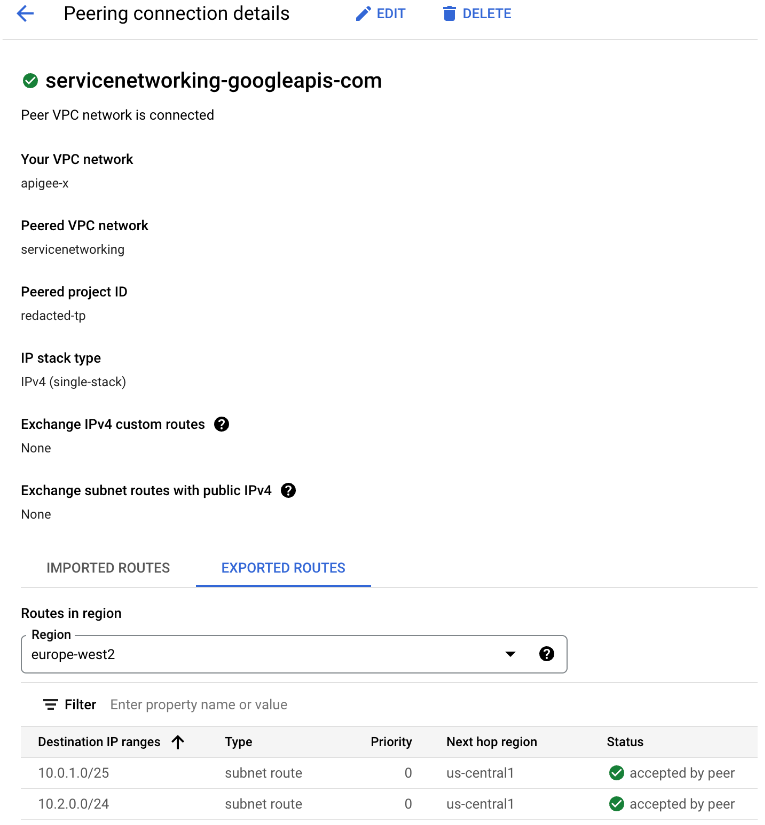
- Click on servicenetworking-googleapis-com, select the
EXPORTED ROUTES tab, and filter by the region obtained in Step 2.
This example shows the 10.2.0.0/24 route as exported and includes the 10.2.0.1 example target IP. If you don't see a route corresponding to your target, that is the cause of the issue.
Resolution
Review your network architecture, and ensure that routes are exported into the VPC peering with
Apigee. Most likely the missing route is either
static or dynamic. Lack
of necessary dynamic routes indicates a problem with the corresponding feature, for example,
Cloud Interconnect.
Please note, transitive peering is not supported. In other words, if
VPC network N1 is peered with N2 and N3, but N2 and N3 are not directly connected, VPC network
N2 cannot communicate with VPC network N3 over VPC Network Peering.
You can read Southbound networking patterns for more information.
Cause: Connectivity issue at target
Diagnosis
The target might not be reachable from the VPC or able to accept a connection. Two options are available to diagnose the issue.
Connectivity Test (Private Target IP addresses)
If the target is in a private network, you can use the Connectivity Test feature to diagnose common causes.
- Identify the IP address of the target resolved from the Apigee instance. One of the methods is
to use a Debug session.
In Debug, navigate to AnalyticsPublisher (or AX in the Classic Debug). Look for the target.ip value on the right side of the screen.
In this example, the IP is 10.2.0.1. This is a private IP address, which means we can use the Connectivity Test.
- Note the IP address of the Apigee instance that is unable to connect to the target.
In Instances in the Apigee Console, find the IP Address of Apigee instance in
the IP Address field.

- Go to
Connectivity Tests
and click on Create connectivity test. Provide these details:
- Source IP Address: Use the Apigee instance IP obtained in Step 2 above. Please note, this is not the exact source IP used by Apigee to send a request to the target, but it's sufficient for the test, as it's in the same subnet.
- This is an IP address used in Google Cloud: Leave unchecked unless the address is in any of your Google Cloud projects. If checking this value, also provide the project and network.
- Put the target address (Step 1) and the port as the Destination IP Address and Destination Port respectively.
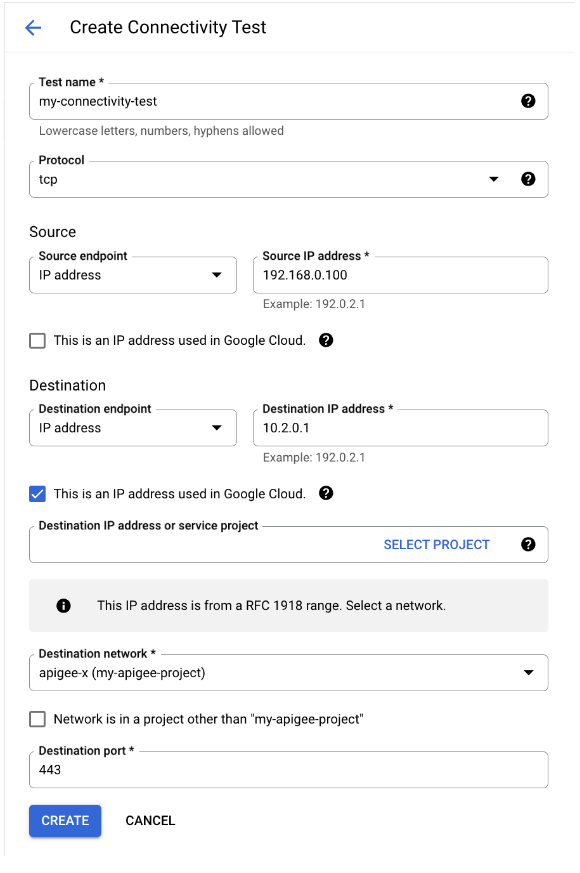
- Click Create and wait for the test to finish the first run.
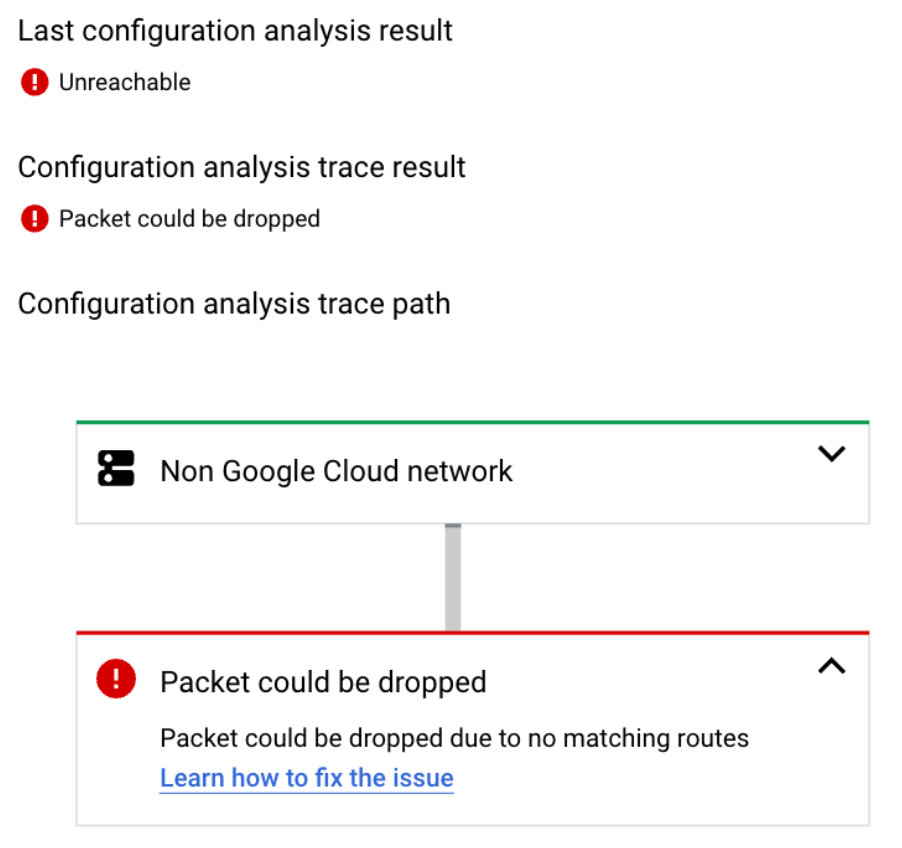
- In the list of connectivity tests, click View to see the results of the execution.
-
If the result is "Unreachable", that means that you have an issue with the
configuration. The tool should direct you to the
Connectivity Tests States documentation
to proceed further. If the status is "Reachable", that rules out many configuration issues.
However, this is not a guarantee that the target is reachable. There hasn't been an actual
attempt to establish a TCP connection with the target. Only the next diagnosis below will help
to test that.
VM connectivity test (all targets)
- In the same VPC that is peered with Apigee, create a VM Instance on Linux.
- Perform connectivity tests from the VM, preferably at the moment when the issue is
reproducible from Apigee. You can use telnet, curl and other utilities to establish a
connection. This curl example runs in a loop with a three seconds timeout. If curl is unable to
establish a TCP connection in three seconds, it fails.
for i in {1..100}; do curl -m 3 -v -i https://[TARGET_HOSTNAME] ; sleep 0.5 ; done - Check the full output and look for this error:
* Closing connection 0
 curl: (28) Connection timed out after 3005 milliseconds
Presence of this error confirms that the issue is reproducible outside of Apigee.
Please note, if you see other errors, such as TLS-related errors, bad status codes, etc., they do not confirm connection timeout and are unrelated to this issue.
- If the target requires IP allow-listing, you may not be able to test it from a VM unless you allow-list the source IP of the VM instance as well.
Resolution
If you identified an issue based on the Connectivity Tests, proceed with the documented resolution steps.
If the timeout is reproduced from a VM, then there is no definite guidance on how to resolve the issue on the target side. Once the connect timeout is reproducible outside of Apigee, pursue the issue further from the VPC. Try to test connectivity as close to the target as possible.
If the target is behind a VPN connection, you might be able to also test it from the local network.
If the target is on the internet, you might try to reproduce the issue outside of Google Cloud console.
If the issue happens at peak hours, the target might be overwhelmed with connections.
If you need to raise a Google Cloud support case at that stage, you no longer need to select the Apigee component, since the issue is now reproducible from the VPC directly.
Cause: IP Allow-listing at target with some or all Apigee NAT IPs not added
Diagnosis
This concerns external targets (the internet) that have IP allow-listing enabled. Ensure that all Apigee NAT IPs are added on the affected target side. If there is no allow-listing at target, you can skip this section.
The issue is easier to spot if errors are intermittent, because in that case you might be able to find a correlation between particular NAT IPs and the errors.
If the issue is persistent (all the calls are failing), please ensure that NAT IPs are enabled on Apigee and fetch them with these steps:
List the NAT IPs for an instance:
curl -H "Authorization: Bearer $TOKEN" \
"https://apigee.googleapis.com/v1/organizations/$ORG_ID/instances/$INSTANCE_NAME/natAddresses"
{
  "natAddresses": [
    {
      "name": "nat-1",
      "ipAddress": "35.203.160.18",
      "state": "ACTIVE"
    },
    {
      "name": "nat-2",
      "ipAddress": "35.230.14.174",
      "state": "RESERVED"
    }
  ]
}
If you have at least one ACTIVE address then it can be allow-listed at the target, therefore there is no misconfiguration on the Apigee side. In that case the address might be missing from the allow-list at target.
If the issue is intermittent, that might indicate that only a subset of NAT IPs has been allow-listed at the target. To identify that:
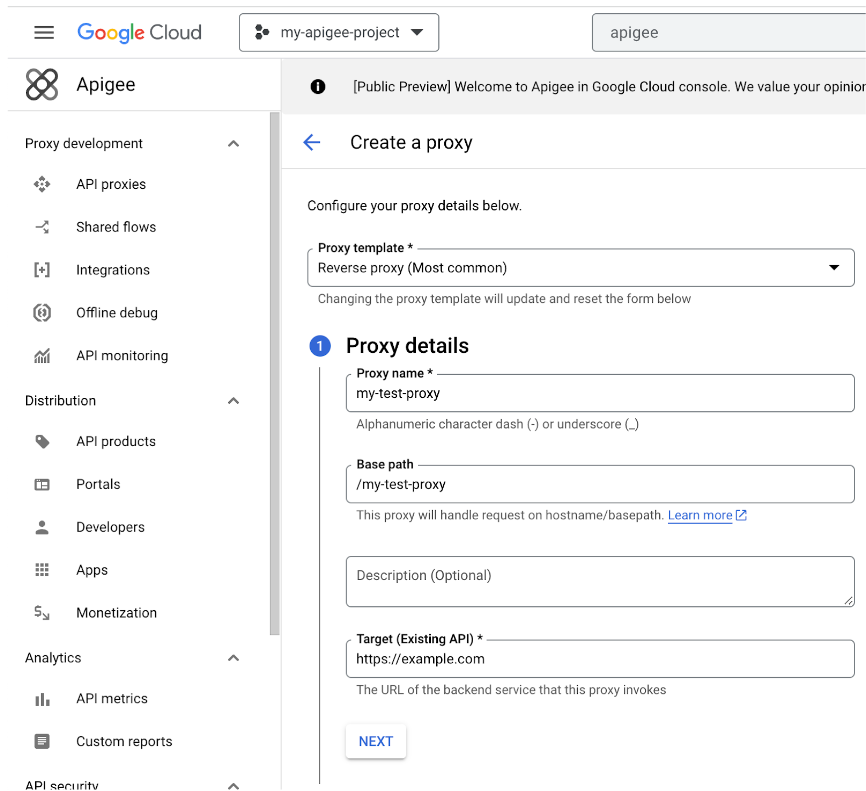
- Create a new Reverse proxy where the affected target is specified in the TargetEndpoint. You
can also reuse the existing proxy instead and move to the next step:
- Add a ServiceCallout policy into the Request PreFlow. The ServiceCallout should call
"https://icanhazip.com", "https://mocktarget.apigee.net/ip", or any other public endpoint that
returns the caller IP address in the response. Store the response in the "response" variable so
that the content is visible in Debug. This is an example ServiceCallout policy configuration:
<?xml version="1.0" encoding="UTF-8" standalone="yes"?>
<ServiceCallout continueOnError="false" enabled="true" name="Service-Callout-1">
    <DisplayName>Service Callout-1</DisplayName>
    <Properties/>
    <Request clearPayload="true" variable="myRequest">
        <IgnoreUnresolvedVariables>false</IgnoreUnresolvedVariables>
    </Request>
    <Response>response</Response>
    <HTTPTargetConnection>
        <Properties/>
        <URL>https://icanhazip.com</URL>
    </HTTPTargetConnection>
</ServiceCallout>
You can also store the response in a custom variable, but you would need to read the ".content" of that variable with the AssignMessage policy to reveal it in the Debug tool.
Ensure that the target is configured in the same exact manner as in the affected proxy.
- Run a Debug session and click on the ServiceCallout step:
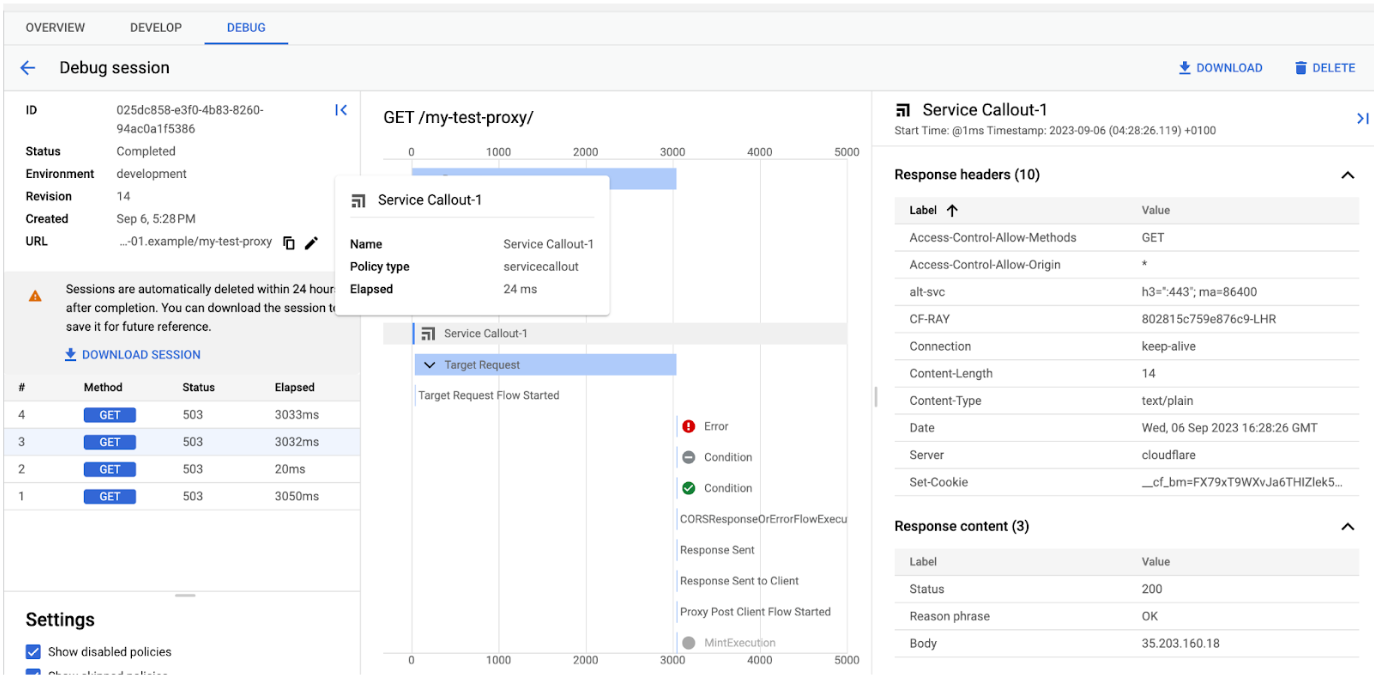
- In the right bottom corner, you should see a Response content section that
contains the NAT IP (in the Body) of the Apigee instance making the request.
Alternatively, if you store the ServiceCallout response in a different place, you should see
it there.
Please note, later in the flow, the proxy will call the target and the Response content will be overwritten with the error or a response from the target. - Try to correlate the NAT IPs with the issue. If you notice that only particular IPs fail, this is a sign that some but not all IPs are allow-listed at the target.
- If you don't see a correlation between NAT IPs and the errors, for example, if the same IP fails in one request but not in the other, then this is most likely not an allow-listing issue. This might be a NAT exhaustion. See Cause: NAT IP port exhaustion.
Resolution
Ensure you have NAT IPs provisioned and activated and ensure that all of them are added on the target side.
Cause: NAT IP port exhaustion
Diagnosis
If the issue is only reproducible from Apigee and NAT IPs are provisioned for your organization, and you see it happening for different targets at the same time, you might be running out of NAT source ports:
- Note the time frame of the issue. For example: daily between 5:58 PM - 6:08 PM.
- Confirm if any other target is affected by the issue in the same time frame. That other target must be accessible via the internet and must not be hosted in the same location as the original affected target.
- Establish if errors only happen above a certain traffic volume in TPS. To do that, note the time frame of the issue, and navigate to the Proxy Performance dashboard.
- Try to correlate the error time window with the rise in Average transactions per second (tps).
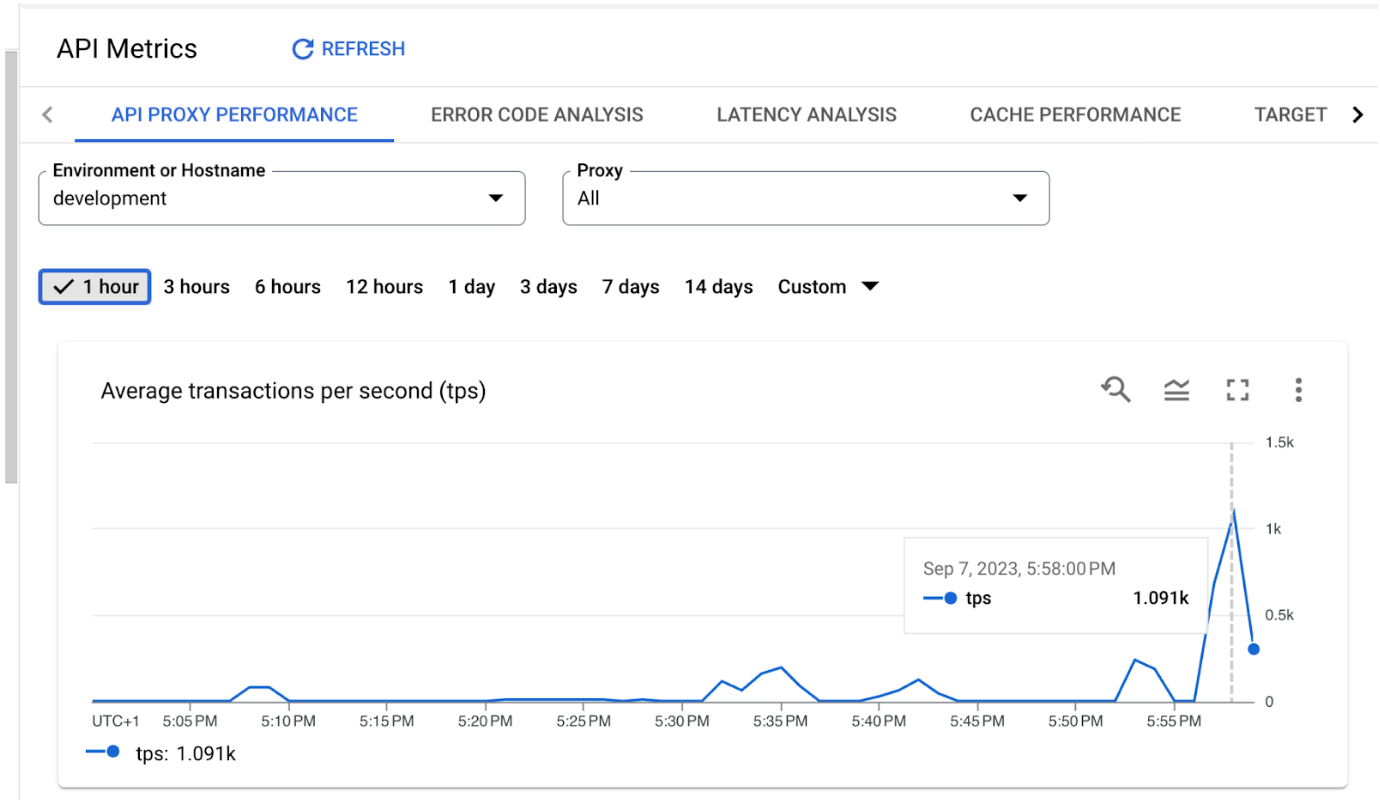
In this example, the tps grows to 1000 at 5:58 PM. Assuming that in this example, 5:58 PM is exactly when the issue happens, and the issue affects two or more unrelated targets, that is a signal of an issue with NAT exhaustion.
Resolution
Re-calculate your NAT IP requirements using the instructions in Calculating static NAT IP requirements.
You can also add more NAT IPs and see if that resolves the issue. Please note, adding more IPs might require allow-listing them at all targets first.
Cause: connect.timeout.millis value is set too low
Diagnosis
You might have an incorrectly configured the timeout value in the proxy.
To check, navigate to the affected proxy and inspect the TargetEndpoint in question. Note the
"connect.timeout.millis" property and its value. In the example here the value is 50, which
is 50 milliseconds and is usually too low to guarantee establishing a TCP connection. If you
see a value below 1000, that's likely the cause of the issue. If you don't see such the
"connect.timeout.millis" property, then the default value is set and the cause is not confirmed.

Resolution
Fix the connect.timeout.millis value, making sure to note that the time units are in milliseconds. The default value is 3000, which is 3000 milliseconds. For more information, see the Endpoints properties reference.
Contact Support for further assistance
If the problem persists after following the above instructions, please gather the following diagnostic information for Google Cloud Support:
- Project ID and the Apigee organization name
- Proxy name(s) and the environment
- Time frame of the issue
- Frequency of the issue
- Target hostname
- Debug session with the issue
- Outcome of the checks performed for the possible causes above. For example, the output of
the
curlcommand from a VM
