Apigee 및 Apigee Hybrid 문서입니다.
이 주제에 해당하는 Apigee Edge 문서가 없습니다.
증상
이 문제는 HTTP 상태가 504인 Gateway Timeout 오류로 표시됩니다.
오류 메시지
API 모니터링, 디버그 또는 다른 도구에서 이 오류가 표시될 수 있습니다.TARGET_READ_TIMEOUT 이유는 요청을 실행하는 동안 Apigee 런타임이 대상으로부터 적시에 응답을 받지 못했음을 나타냅니다.
기본 대상 읽기 제한 시간 값(io.timeout.millis)은 55초입니다. 즉, 55초 후에 대상이 응답하지 않으면 Apigee에서 다음 오류가 발생합니다.
{"fault":{"faultstring":"Gateway Timeout",
  "detail":{"errorcode":"messaging.adaptors.http.flow.GatewayTimeout",
  "reason":"TARGET_READ_TIMEOUT"}}}
가능한 원인
| 원인 | 설명 | 다음에 관한 문제 해결 안내 |
|---|---|---|
| 느린 대상 | 대상이 적시에 응답을 생성하지 않습니다. | Apigee X 및 Apigee Hybrid |
| TargetServer 연결 문제 | TargetEndpoint에 <LoadBalancer>가 구성된 경우 대상에 일반적인 연결 문제가 있습니다.
|
Apigee X 및 Apigee Hybrid |
원인: 느린 대상
진단
Apigee 디버그 도구를 사용하여 느린 대상 문제를 진단할 수 있습니다.
- API 프록시에 대한 디버그 세션을 만듭니다.
- 디버그 세션에서 요청을 전송하고 디버그 출력을 검사합니다.
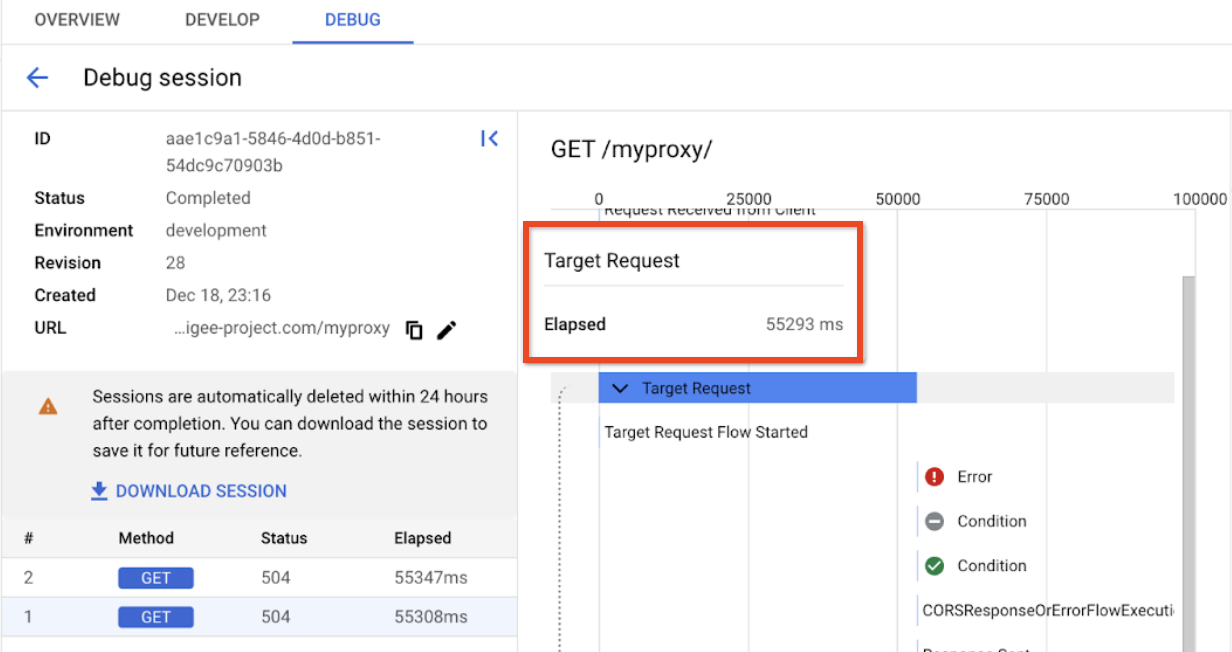
위의 예시에서 볼 수 있듯이 대상 요청이 기본 대상 제한 시간 한도인 55초를 초과했습니다. 시간 한도는 구성할 수 있으며 제한 시간을 변경한 경우 대상 요청 소요 시간은 설정한 제한 시간과 일치합니다. 예를 들어 제한 시간이 10초라면 이 시나리오에서는 대상 요청이 10초 후에 시간 초과됩니다. 이러한 '느린 대상' 동작은 대상이 제시간에 요청에 응답하지 않음을 명확하게 나타냅니다.
해결 방법
Apigee에서는 느린 대상을 사용하지 않는 것이 좋습니다. 예를 들어 정상 대상 지연 시간이 50ms이고 지연 시간이 55,000ms이면 대상에 문제가 있는지 조사해야 할 수 있습니다.
제한 시간을 늘려야 하면 다음 단계를 수행합니다.
- 프록시 편집기에서 개발 탭을 클릭합니다.
- 탐색창에서 영향을 받는 대상 엔드포인트를 선택합니다.
- XML 편집기에서
HTTPTargetConnectionXML 요소를 찾습니다.
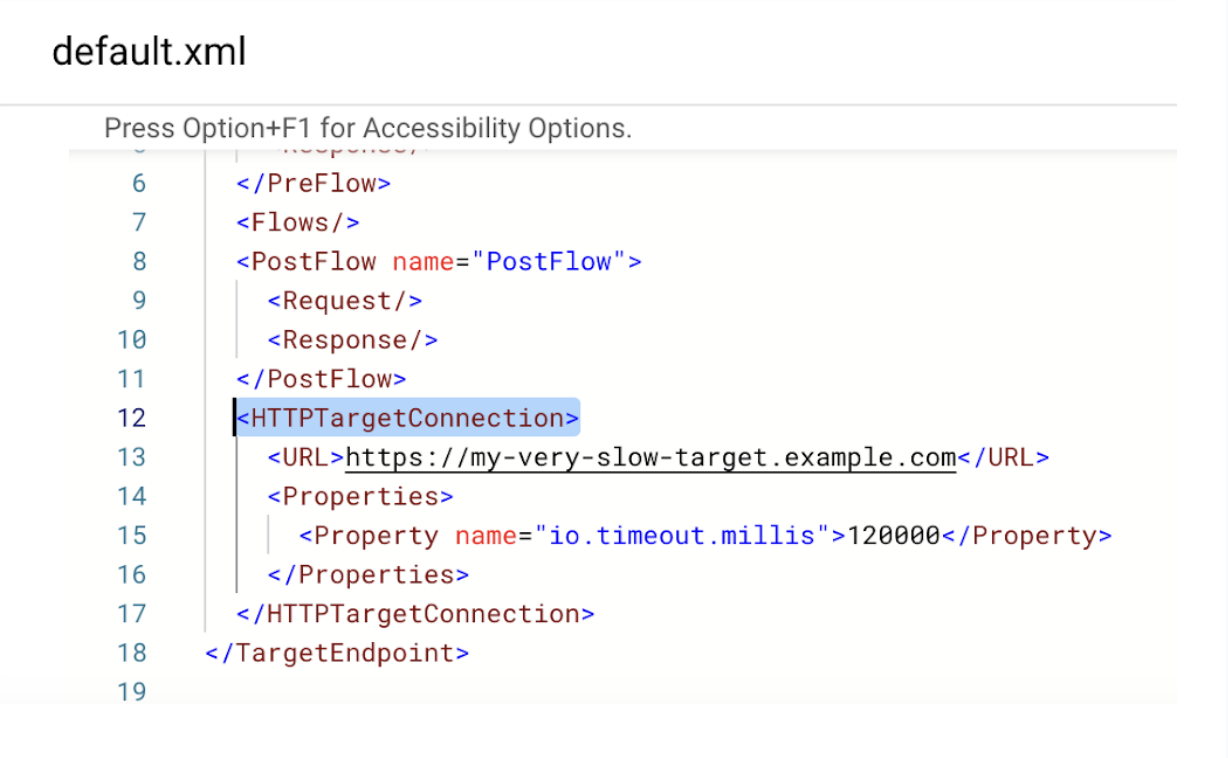
<HTTPTargetConnection>요소 아래에io.timeout.millis속성을 추가하고 새 시간 제한을 밀리초 단위로 지정합니다. 예를 들면 다음과 같습니다.<HTTPTargetConnection> <URL>https://my-very-slow-target.example.com</URL> <Properties> <Property name="io.timeout.millis">120000</Property> </Properties> </HTTPTargetConnection>위 예시에서는 제한 시간이 120초로 증가했습니다. 최대 한도는 300초입니다. 자세한 내용은 엔드포인트 속성 참조를 확인하세요.
- 새 버전을 저장하고 프록시를 배포합니다.
문제가 계속되면 아래의 진단 정보를 수집해야 함으로 이동합니다.
원인: TargetServer 연결 문제
진단
Apigee는 <LoadBalancer> 엔드포인트 속성을 구성할 때 연결 문제의 정확한 원인을 공개하지 않습니다. 하지만 대상 요청의 경과 시간에서 연결 문제의 원인을 유추할 수 있습니다. 디버깅 메서드로 <LoadBalancer> 요소를 모두 삭제하고 프록시에서 직접 대상에 도달해 볼 수 있습니다.
문제를 진단하려면 디버그 도구를 사용하세요.
- API 프록시에 대한 디버그 세션을 만듭니다.
- 디버그 세션에서 요청을 전송하고 디버그 출력을 검사합니다.
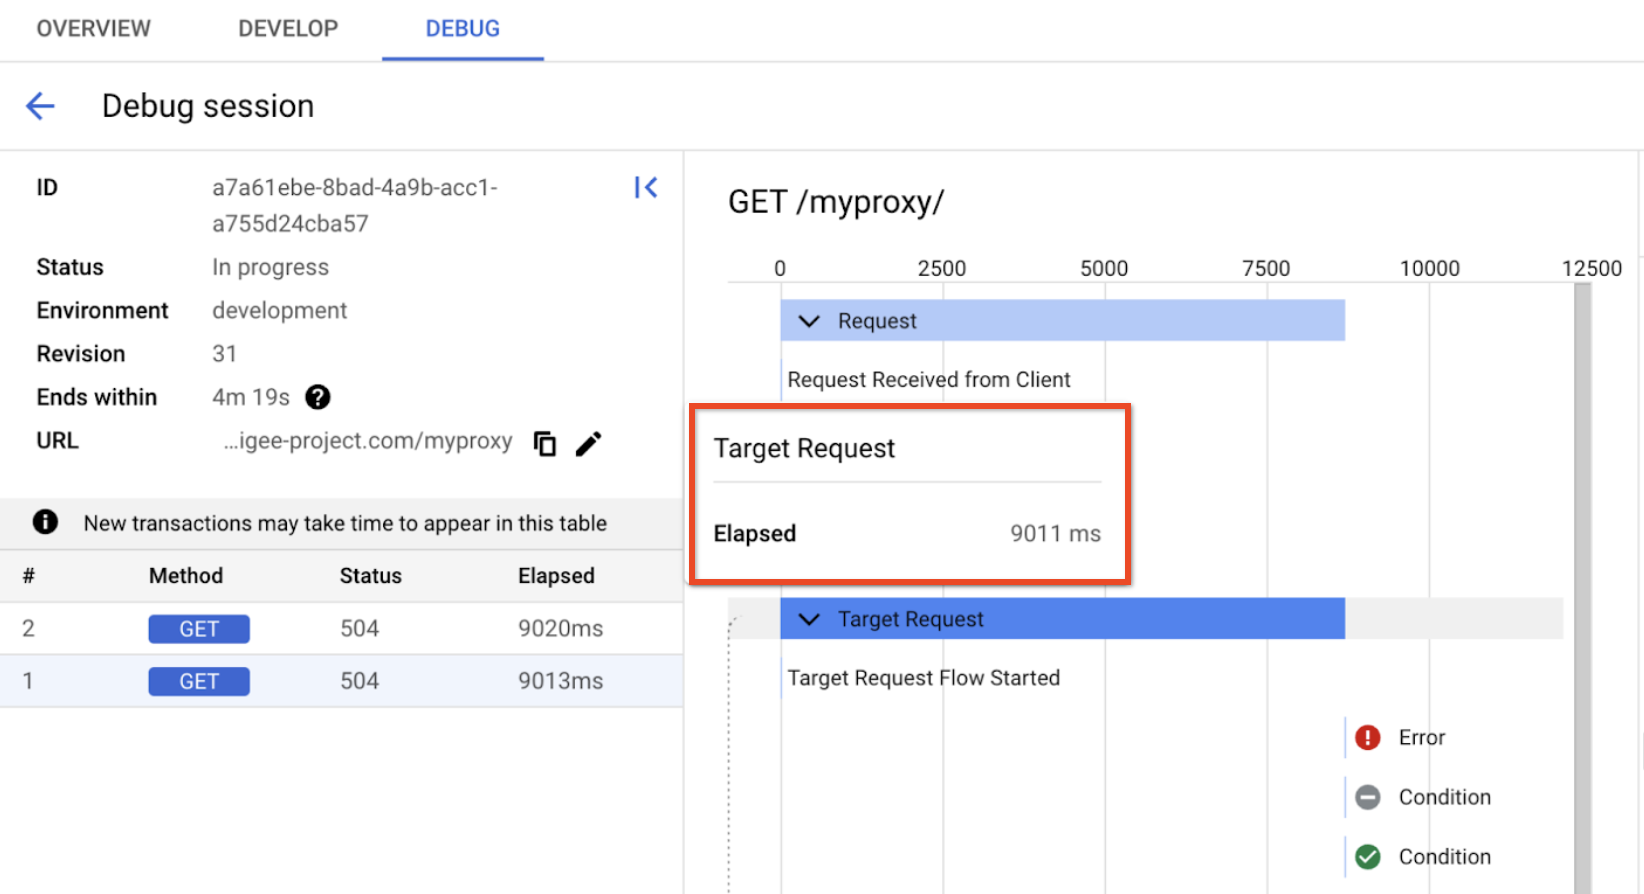
위의 예시에서는 시간 초과가 발생하는 데 9초가 걸렸습니다. 55초가 아니기 때문에 느린 대상으로 인해 제한 시간이 초과된 것이 오류의 원인입니다.
기본적으로 <LoadBalancer> 요소가 TargetEndpoint에 사용된 경우 Apigee는 연결을 두 번 더 재시도합니다. 연결이 총 3회 시도되었고 연결 오류의 기본 제한 시간이 3초(connect.timeout.millis)임을 알고 있으므로 문제가 연결 문제라고 가정할 수 있습니다.
해결 방법
문제가 연결 제한 시간으로 확인되면 TARGET_CONNECT_TIMEOUT과 함께 VPC 피어링 503 서비스를 사용할 수 없음 오류를 참조하세요.
다른 문제의 경우 <LoadBalancer> 요소를 삭제하여 정확한 오류 코드를 디버깅 및 표시하고 오류 카탈로그에서 코드를 확인하세요.
진단 정보 수집 필요
위 안내를 따른 후에도 문제가 지속되면 다음 진단 정보를 수집한 후 Google Cloud 지원팀에 연락합니다.
- 프로젝트 ID 및 Apigee 조직 이름
- 프록시 이름 및 환경
- 문제가 발생한 기간
- 문제 빈도
- 대상 호스트 이름
- 문제가 있는 디버그 세션