このドキュメントでは、Cloud Tools for Visual Studio の [Error Reporting] タブで Google Cloud Observability のエラーレポートにアクセスして表示する方法について説明します。
始める前に
Cloud Logging のログに例外を記録するようにアプリケーションを設定します。
[Error Reporting] タブへのアクセス
Visual Studio でエラーレポートにアクセスして表示するには、[ツール] -> [Google Cloud Tools] -> [Show Stackdriver Error Reporting] を選択します。
![[Stackdriver Error Reporting] タブを示す画像](https://cloud.google.com/static/tools/visual-studio/img/stackdriver-overview.png?hl=ja)
エラーレポートに関する情報
レポートには次の情報が表示されます。
| 列 | 説明 |
|---|---|
| 発生回数 | 選択した期間内でエラーが発生した回数。 |
| ユーザー | 選択した期間内でエラーの影響を受けるユーザー数。 |
| エラー | エラーのスタック トレースから抽出したエラー情報(エラー メッセージとそのコードのロケーションを含む)を提供します。 |
| 検知されたバージョン | エラーが発生したサービスとバージョンを一覧表示します。 |
| 初回検知 | エラーが最初に発生した時刻。この列で並べ替えると、最近発生し始めたエラーの検出に便利です。 |
| 最終検知 | エラーが最後に発生した時刻。この列で並べ替えると、発生が継続しているエラーの参照に便利です。また、逆の順序に並べ替えて、どれが停止したかを確認することもできます。 |
| ステータス | このエラーにより返された HTTP ステータス コード(可能な場合)。 |
Error Reporting では、スタック トレースを分析して、重複するエラーを削除し、アプリケーションのプログラミング言語で使用される一般的なフレームワークに従ってエラーをグループ化します。
期間ボタンを選択して、指定した時間枠内で発生したエラーのみを表示できます。たとえば、[1 hour] をクリックすると、過去 1 時間以内に発生したエラーが表示されます。
[Auto reload] をクリックすると、リストが 10 秒ごとに更新されます。
エラーの詳細の表示
特定のエラーの詳細を表示するには、エラーリストのその行をクリックします。エラーの [Detail View] タブが表示されます。
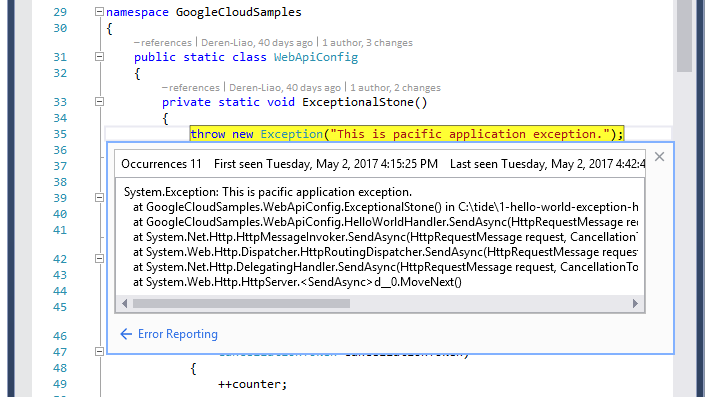
![選択したエラーの [Detail View] タブを示す画像](https://cloud.google.com/static/tools/visual-studio/img/stackdriver-details.png?hl=ja)
選択したエラーの履歴を調べたり、一連のエラーのサンプルに含まれる診断情報にアクセスしたりすることができます。C# アプリケーションは、解析されたスタック トレースを含むサンプルを生成します。
Error Reporting では、類似したエラーをグループ化し、エラーのサンプルは 1,000 個のみ保持して、後は推定します。各サンプルに関し、UI は Error Reporting に提供されるデータを表示します。
エラーのソースコードの表示
C# アプリケーションとデバッグビルドのエラーには、スタック フレームでのソースコードのロケーション情報が含まれています。ソースコードを参照するには、ソースリンクをクリックします。まず、現在の Visual Studio ソリューションにファイルを含むプロジェクトを読み込む必要があります。