데이터베이스 관측 가능성은 로그, 측정항목, trace에서 생성되는 데이터 또는 원격 분석을 기반으로 데이터베이스 시스템의 내부 상태를 얼마나 정확하게 추론할 수 있는지 측정합니다.
애플리케이션의 문제 진단 및 문제 해결은 데이터베이스가 포함될 때 특히 까다롭고 시간이 오래 걸릴 수 있습니다. 원격 분석 컬렉션은 매우 중요합니다. 원격 분석을 애플리케이션 컨텍스트로 보강하면 데이터베이스 인스턴스를 이해, 관측, 유지보수하기가 더 쉬워집니다.
비용이 많이 드는 다운타임 없이 문제와 문제가 있는 트렌드를 손쉽게 파악하고 조기에 해결할 수 있습니다. 또한 이러한 데이터를 사용함으로써 시작 시점부터 올바른 종류의 데이터를 수집하도록 새 데이터베이스 인스턴스를 구성할 수 있습니다.
데이터를 효과적으로 사전에 사용하여 문제를 방지하고 전략적 혁신에 집중할 수 있습니다. 우수한 원격 분석 수집은 데이터베이스 일반 사용자가 원격 분석을 독립적으로 분석하여 급속하게 진화하는 애플리케이션의 성능과 상태를 모니터링, 평가, 최적화해야 하는 DevOps 모델에서 특히 유용합니다.
Google Cloud 는 Cloud SQL 데이터베이스의 상태를 유지하는 데 도움이 되도록 반복되는 4가지 모니터링 가능성 단계에 걸친 여러 강력한 기능을 제공합니다.
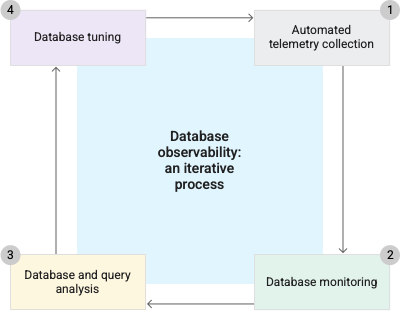
자동화된 원격 분석 컬렉션
Google은 관측 가능성 목표를 달성하기 위해 가급적 자동화된 프로세스를 통해 원격 분석을 수집하는 것부터 시작합니다. 원격 분석을 일정 기간 수집하면 다양한 부하 조건에서 측정항목의 기준을 설정하는 데 도움이 됩니다.
Google Cloud 서비스는 완전한 모니터링 가능성 개요를 제공하는 데 도움이 되는 측정항목, 로그, trace를 포함한 모니터링 가능성 데이터를 자동으로 생성합니다.
Cloud Monitoring은 서비스 및 사용 중인 Google Cloud 리소스의 측정값을 수집합니다. Cloud SQL은 내장된 메모리 커스텀 에이전트를 사용하여 쿼리 원격 분석을 수집하므로 성능에 미치는 영향이 줄어들고 에이전트 유지보수 또는 보안 오버헤드가 필요하지 않습니다.
Cloud Trace는 애플리케이션을 통해 요청이 전파되는 방식을 추적할 수 있도록 애플리케이션에서 지연 시간 데이터 및 실행된 쿼리 계획을 수집합니다. 시간 경과에 따라 또는 버전 간에 이러한 지연 시간 분포를 비교할 수 있습니다. Cloud Trace는 Cloud Trace를 사용하도록 계측된 애플리케이션의 지연 시간 프로필에서 큰 변화가 감지되었을 때 알림을 표시합니다.
데이터베이스용 OpenTelemetry 라이브러리인 Sqlcommenter는 애플리케이션의 관점에서 데이터베이스를 모니터링하는 데 도움이 됩니다. Sqlcommenter는 ORM을 자동으로 계측하여 SQL 문을 태그로 보강하고 OpenTelemetry trace 컨텍스트 정보를 데이터베이스에 전파할 수 있도록 합니다.
데이터베이스에서 태그와 trace 애플리케이션 컨텍스트를 사용하면 애플리케이션 코드를 데이터베이스 성능과 손쉽게 연관시키고 마이크로서비스 기반 아키텍처의 문제를 쉽게 해결할 수 있습니다.
데이터베이스 모니터링
적절한 모니터링을 통해 애플리케이션이 최적으로 작동하는지 확인할 수 있습니다.
마이그레이션 시작 전 또는 새 애플리케이션을 프로덕션 환경에 배포하기 전 등 사전에 모니터링을 구현합니다. 애플리케이션 문제와 근본적인 클라우드 문제를 구별합니다.
[[["이해하기 쉬움","easyToUnderstand","thumb-up"],["문제가 해결됨","solvedMyProblem","thumb-up"],["기타","otherUp","thumb-up"]],[["이해하기 어려움","hardToUnderstand","thumb-down"],["잘못된 정보 또는 샘플 코드","incorrectInformationOrSampleCode","thumb-down"],["필요한 정보/샘플이 없음","missingTheInformationSamplesINeed","thumb-down"],["번역 문제","translationIssue","thumb-down"],["기타","otherDown","thumb-down"]],["최종 업데이트: 2025-08-13(UTC)"],[],[],null,["# About database observability\n\n\u003cbr /\u003e\n\n[MySQL](/sql/docs/mysql/observability \"View this page for the MySQL database engine\") \\| [PostgreSQL](/sql/docs/postgres/observability \"View this page for the PostgreSQL database engine\") \\| SQL Server\n\n\u003cbr /\u003e\n\nDatabase observability is a measure of how accurately you can infer the internal\nstate of a database system based on the data, or telemetry, that it generates in\nlogs, metrics, and traces.\n\nDiagnosing and troubleshooting issues in an application can be particularly\ndifficult and time-consuming when a database is involved. Telemetry collection\nis crucially important. Telemetry, when enriched with application context, can\nmake database instances more understandable, observable, and easier to maintain.\nYou can identify issues and problematic trends easily and remedy them early,\nwithout having to incur costly downtime. Moreover, by using such data, you can\nconfigure newer database instances to collect the right kind of data from the\nmoment they start.\n\nYou can use data effectively and proactively to prevent issues and focus\non strategic innovation. Good telemetry collection is particularly useful\nin the [DevOps model](https://cloud.google.com/devops), where database\ngeneralists need to independently analyze telemetry to monitor, evaluate, and\noptimize the performance and health of their rapidly evolving applications.\n\nGoogle Cloud offers several powerful features spanning the four iterative\nobservability stages to help you maintain the health of your Cloud SQL\ndatabase.\n\nAutomated telemetry collection\n------------------------------\n\nTo achieve observability goals, we start by collecting telemetry,\npreferably through an automated process. When collected over a period,\ntelemetry helps establish a baseline for metrics under different load conditions.\n\nGoogle Cloud services automatically generate observability data, including metrics,\nlogs, and traces, which can help provide a complete observability overview.\n\n- [Cloud Monitoring](/monitoring/docs/monitoring-overview) collects measurements\n of your service and of the Google Cloud resources that you use. Cloud SQL uses\n built-in memory custom agents to collect query telemetry, resulting in a lower\n impact on performance and eliminating the need for agent maintenance or security overhead.\n\n- [Cloud Logging](/logging/docs/overview) collects logging data from\n common application components. For Cloud SQL, see also\n [View instance logs](/sql/docs/sqlserver/logging).\n\n- [Cloud Trace](/trace/docs/overview) collects latency data and executed\n query plans from applications to help you track how requests propagate through\n your application. You can compare these latency distributions over time or\n across versions. Cloud Trace alerts you when it detects a\n significant shift in the latency profile of your application when it's\n instrumented to use Cloud Trace.\n\n[Sqlcommenter](https://google.github.io/sqlcommenter/spec/),\nan [OpenTelemetry](https://cloud.google.com/learn/what-is-opentelemetry) library\nfor databases helps you monitor your databases through the lens of an\napplication. Sqlcommenter automatically instruments ORMs to augment SQL\nstatements with tags and allows OpenTelemetry trace context information to be\npropagated to the database.\n\nWith tags and trace application context in databases, it's easy to correlate\napplication code with database performance and troubleshoot microservices-based\narchitectures.\n\nDatabase monitoring\n-------------------\n\nProper monitoring helps you determine whether your application is working optimally.\nImplement monitoring early, such as before you initiate a migration or\ndeploy a new application to a production environment. Disambiguate between\napplication issues and underlying cloud issues.\n\nThe Cloud SQL [Overview page](/sql/docs/sqlserver/monitor-instance#monitoring-overview) shows graphs for some of the key metrics.\n\nCloud SQL also helps you [compare metrics](/sql/docs/sqlserver/monitor-instance#monitoring-multiple) for selected instances.\n\nYou can use Cloud Monitoring to create [custom dashboards](/monitoring/charts/dashboards)\nthat help you monitor metrics and to [set up alert policies](/monitoring/alerts/using-alerting-ui#viewing_policies)\nso that you can receive timely notifications.\n\nDatabase tuning\n---------------\n\nYou can iteratively [troubleshoot and tune](/sql/docs/sqlserver/best-practices#tuning-monitoring)\nyour database.\n\nCloud SQL recommenders help you analyze the current usage of your database\nand provide [recommendations](/recommender/docs/key-concepts#recommendations)\nand [insights](/recommender/docs/insights/using-insights#insights) based on\nheuristic methods and machine learning.\n\nCloud SQL recommenders are briefly described as follows:\n\nWhat's next\n-----------\n\n- View the list of [Cloud SQL metrics](/sql/docs/sqlserver/admin-api/metrics).\n- Learn more about [Cloud Logging](/logging/docs/overview) and [Cloud Monitoring](/monitoring/docs/monitoring-overview). See also [View instance logs](/sql/docs/sqlserver/logging).\n- [Troubleshoot and tune](/sql/docs/sqlserver/best-practices#tuning-monitoring) your database instance.\n- Learn more about [Google Cloud recommenders](/recommender/docs/overview)."]]