Security graph in Security Command Center is a relationship-aware database that maps cloud resources, their configurations, and associated risk indicators such as vulnerabilities, access permissions, data sensitivity, and network exposure. The graph provides a comprehensive view of your cloud assets and their relationships.
In this document, you learn about Graph Search, a feature that lets you explore the security graph by creating custom queries to help pinpoint potential security concerns in your environment.
Query components
Security graph queries consist of three main component types:
- Node: a security finding or a cloud resource.
- Where clause (filter): a filter that's applied to a node to refine the query based on the specific properties of the node.
- Connection: a directional relationship between two nodes.
The following is an example of a query as seen in the Google Cloud console, using these components.
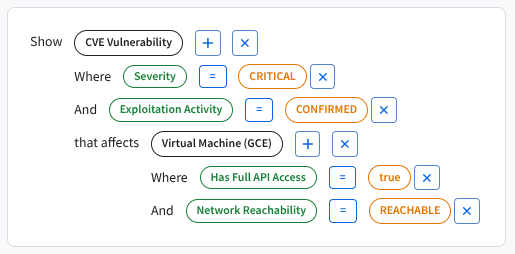
This example query structure identifies a relationship between security entities to help pinpoint risk. First, the query establishes the key subjects, or nodes, of the investigation, the CVE Vulnerability and the Virtual Machine (GCE). The connection, identified by the phrase that affects, explicitly links these two nodes. Finally, the query is finely tuned using multiple attributes, known as where clauses or filters, on each node. The filters that are used here include the vulnerability's severity and the VM's network reachability. Together, these components help identify potential risks in an environment.
Node
A node represents a security finding or a cloud resource.
Some examples of a node in the Google Cloud console include the following:
- CVE Vulnerability: a Common Vulnerabilities and Exposures vulnerability defined by The MITRE Corporation.
- Virtual Machine (GCE): a Compute Engine instance.
- GKE Deployment: a Google Kubernetes Engine resource.
- IAM Service Account: an Identity and Access Management (IAM) service account.
- BigQuery Dataset: a container of data in BigQuery. For more information, see Introduction to datasets.
Nodes are grouped by categories such as Compute, Kubernetes, Identity, and Databases. You can browse or search all available node types in the Google Cloud console when constructing your query.
Where clause (filter)
A where clause is a filter that's applied to a node to refine the query based on the specific properties associated with the node.
The following are some examples of filters:
- Severity = Critical: an item of critical severity, for example, a CVE.
- Has Full API Access = True: indicates that a node is configured with full access to all Google Cloud APIs.
- Exploitation Activity = Confirmed: indicates known, reported, or anticipated instances of a vulnerability being exploited in the wild.
Filters shown in the Google Cloud console are context-aware and depend on the type of node that you have selected.
Connection
A connection is a directional relationship between two nodes.
The following are examples of connections:
- that affects: defines the relationship between two selected nodes—for example, a CVE Vulnerability in relation to a Virtual Machine (GCE).
- that uses: defines the relationship between two selected nodes—for example, a Virtual Machine (GCE) in relation to an IAM Service Account.
Connections are context-aware, and only valid relationships are shown for the selected node type.
Build a query
You can query the security graph to explore your cloud environment based on criteria that are important to you. Performing and refining queries on the graph can help you identify specific security weaknesses that you want to monitor.
Premium
To open the security graph query page, go to the Security Command Center Graph Search page.
Use the query editor to build your query.
Choose an option:
- Select a predefined search suggestion and use it as-is.
- Modify the query to fit your needs.
Run your query.
Review the query results in the table. You can customize the results view by selecting what columns to display. You can also sort each column in ascending or descending order.
Export query results as a CSV file using the Download CSV option.
Enterprise
To open the security graph query page, go to the Security Command Center Risk Overview > Graph Search page.
Use the query editor to build your query.
Choose an option:
- Select a predefined search suggestion and use it as-is.
- Modify the query to fit your needs.
Run your query.
Review the query results in the table. You can customize the results view by selecting what columns to display. You can also sort each column in ascending or descending order.
Export query results as a CSV file using the Download CSV option.
Create custom queries
You can define custom queries to identify security vulnerabilities specific to your environment.
To create a custom query, either start a new query or customize an existing search suggestion using the following steps:
Premium
In the Google Cloud console, go to the Security Command Center Graph Search page.
In the Show field, click and select a resource or finding as the primary node for your query, and then click Select.
To refine your query, click the toggle for any filter or connection to enable it for the selected node. Define the value for each filter you enable, and then click Select.
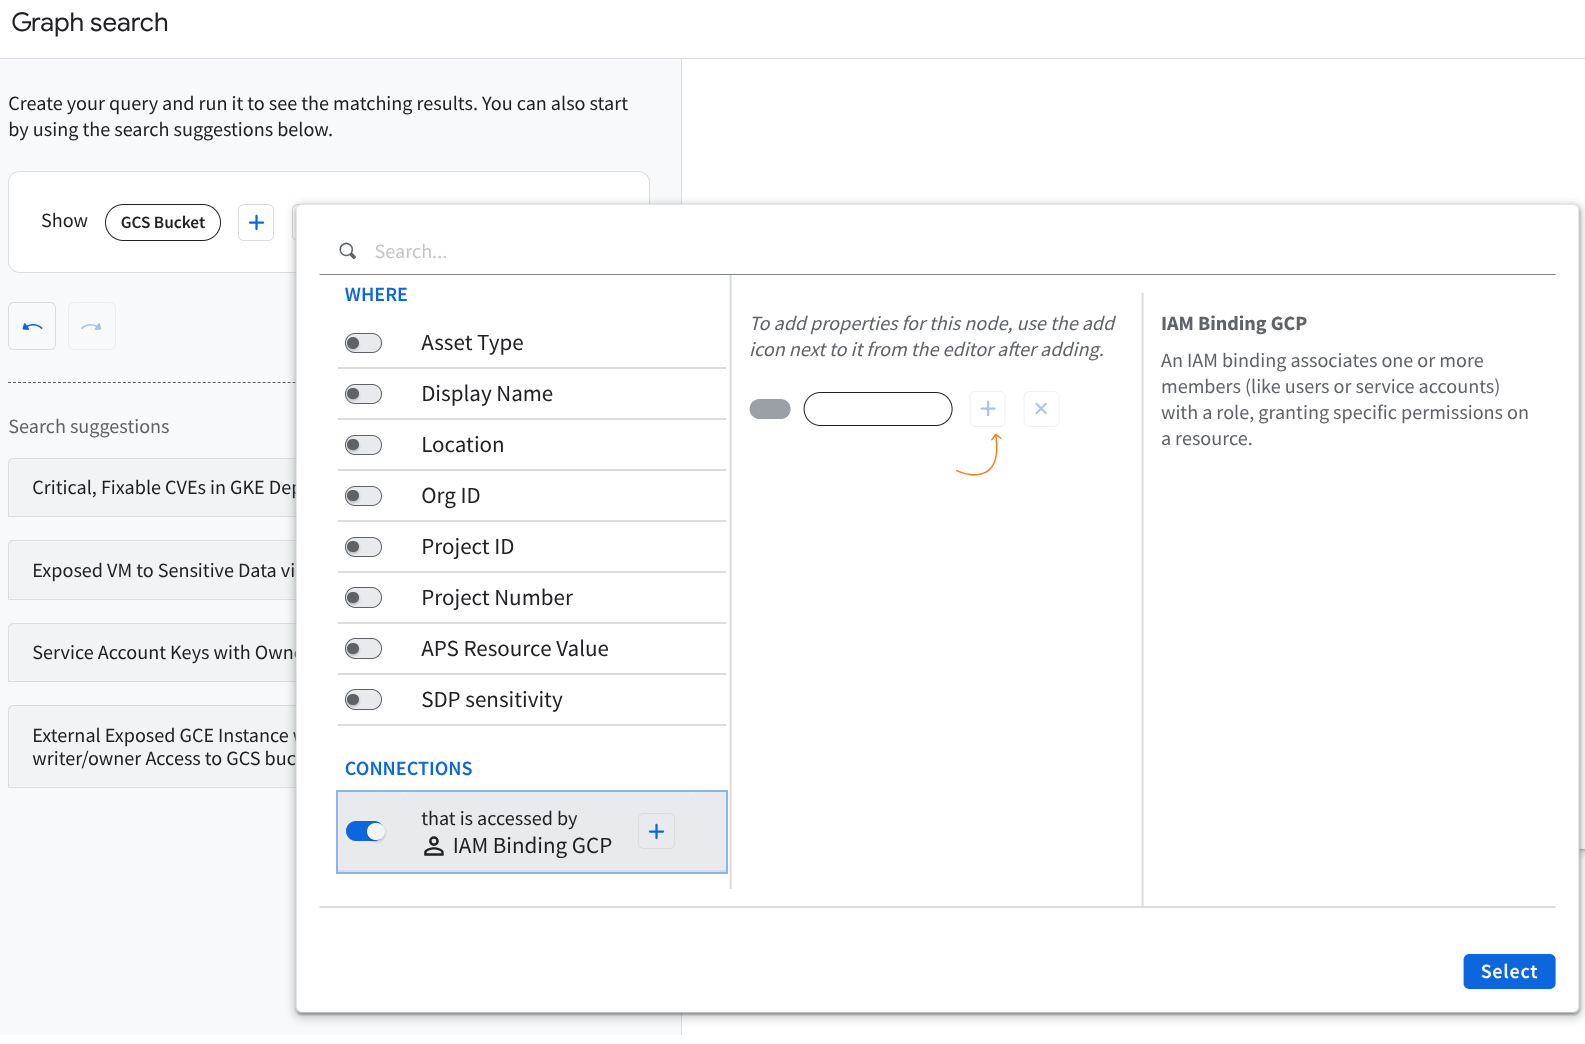
Security Command Center Graph search widget (click to enlarge) To make additional changes, click the plus icon () that's associated with a node or connection to make updates. Click to remove a component from your query.
Select Run query.
As the graph schema evolves, the available nodes, filters, and connections are updated in the Google Cloud console.
Enterprise
In the Google Cloud console, go to the Security Command Center Graph Search page.
In the Show field, click and select a resource or finding as the primary node for your query, and then click Select.
To refine your query, click the toggle for any filter or connection to enable it for the selected node. Define the value for each filter you enable, and then click Select.
Security Command Center Graph search widget (click to enlarge) To modify your query even more, click the plus icon () that's associated with a node or connection to make updates. Click to remove a component from your query.
Select Run query.
As the graph schema evolves, the available nodes, filters, and connections are updated in the Google Cloud console.
Use or customize a search suggestion
Several search suggestions are provided as starting points. You can use these suggestions as-is or customize them to fit your specific requirements.
Premium
In the Google Cloud console, go to the Security Command Center Graph Search page.
Select a Search suggestion to see more detailed information about the query.
Click Use suggestion.
Optional: Modify the query details in the editor to suit your needs. For more information, see Create custom queries.
Click Run query.
Enterprise
In the Google Cloud console, go to the Security Command Center Risk Overview > Graph Search page.
Select a Search suggestion to see more detailed information about the query.
Click Use suggestion.
Optional: Modify the query details in the editor to suit your needs. For more information, see Create custom queries.
Click Run query.
Troubleshoot queries that return no results
If your query returns no results, try the following steps to troubleshoot and adjust.
Use a predefined search suggestion
The predefined search suggestions provided are examples designed to return results relevant to a variety of environments. You can modify search suggestions to suit your specific needs.
Simplify or adjust your query
Remove or reduce filters to broaden the scope of your query.
Try querying a single asset type or property to validate that data is being returned.
Avoid combining too many constraints. Doing so could unintentionally exclude results.
Verify access permissions
Make sure that you have the necessary permissions to view the data you're querying. Without the correct access, some assets or relationships might be hidden or excluded from results.
Allow time for data sync
Recently created or updated resources might take a few minutes or hours to appear in the graph. For example, delays can occur if you've just added a resource or updated IAM policies. If you've just made changes to your cloud environment, try running the query again after some time.
Graph coverage
Some data types or relationships might not be available in the security graph, depending on your environment and the supported data types. If you're not seeing expected data, it might not be available in the graph.
Additional help
If you've tried the preceding steps and still aren't seeing the expected results, contact your project administrator or see Getting support for assistance reviewing your query configuration and permissions.
What's next
- Learn more about Security Command Center issues.
- Manage and remediate issues