El registro de OpenTelemetry te permite identificar y registrar la latencia de varias operaciones de la biblioteca cliente de Pub/Sub, como el procesamiento por lotes, la administración de arrendamientos y el control de flujo. Recopilar esta información puede ayudarte a depurar problemas de la biblioteca cliente.
Estos son algunos casos de uso potenciales del seguimiento de OpenTelemetry:
- Tu servicio está experimentando una latencia de publicación más alta de lo normal.
- Estás experimentando una gran cantidad de reenvíos de mensajes.
- Un cambio en la función de devolución de llamada del cliente suscriptor hace que el procesamiento tarde más de lo habitual.
Antes de comenzar
Antes de configurar OpenTelemetry, completa las siguientes tareas:
- Configura Pub/Sub con una de las bibliotecas cliente.
- Instala el SDK de OpenTelemetry y configura un exportador de seguimiento y un proveedor de seguimiento.
- Habilita la API de Cloud Trace.
- Obtén información para leer los registros de Cloud Observability.
Roles requeridos
Para garantizar que la cuenta de servicio tenga los permisos necesarios para exportar registros a Cloud Trace, pídele a tu administrador que le otorgue a la cuenta de servicio los siguientes roles de IAM en tu proyecto:
-
Todos:
Agente de Cloud Trace (
roles/cloudtrace.agent)
Para obtener más información sobre cómo otorgar roles, consulta Administra el acceso a proyectos, carpetas y organizaciones.
Estos roles predefinidos contienen los permisos necesarios para exportar registros a Cloud Trace. Para ver los permisos exactos que son necesarios, expande la sección Permisos requeridos:
Permisos necesarios
Se requieren los siguientes permisos para exportar registros a Cloud Trace:
-
Todos:
cloudtrace.traces.patch
Es posible que tu administrador también pueda otorgar estos permisos a la cuenta de servicio con roles personalizados o con otros roles predefinidos.
Flujo de trabajo de seguimiento de OpenTelemetry
Para configurar el registro de OpenTelemetry, usa las bibliotecas cliente de Pub/Sub y el SDK de OpenTelemetry. Con el SDK, debes configurar un exportador de registros y un proveedor de registros antes de conectarte a las bibliotecas de Pub/Sub. En algunas bibliotecas, configurar un proveedor de trazador es opcional.
Exportador de registros. El SDK de OpenTelemetry usa el exportador de seguimiento para determinar dónde enviar los seguimientos.
Proveedor de registros. Las bibliotecas cliente de Pub/Sub usan el proveedor de seguimiento para crear seguimientos.
En los siguientes pasos, se describe cómo configurar el registro de seguimiento:
- Crea una instancia de un exportador de OpenTelemetry de Cloud Trace.
- Si es necesario, crea una instancia y registra un Tracer Provider con el SDK de OpenTelemetry.
- Configura tu cliente con la opción para habilitar el seguimiento de OpenTelemetry.
- Usa las bibliotecas cliente de Pub/Sub para publicar un mensaje.
Cómo funciona el rastreo
Para cada mensaje publicado, la biblioteca cliente crea un nuevo registro de seguimiento. Este registro representa todo el ciclo de vida del mensaje, desde el momento en que publicas un mensaje hasta que se confirma su recepción. Un registro abarca información como la duración de las operaciones, los intervalos superiores y los intervalos secundarios, y los intervalos vinculados.
Un registro consta de un intervalo raíz y sus correspondientes intervalos secundarios. Estos intervalos representan el trabajo que realiza la biblioteca cliente cuando procesa un mensaje. Cada seguimiento de mensajes contiene lo siguiente:
- Para publicar Control de flujo, programación de claves de ordenamiento, procesamiento por lotes y duración de la RPC de publicación.
- Para suscripciones. Control de simultaneidad, programación de claves de ordenamiento y administración de arrendamientos.
Para propagar información del lado de la publicación al lado de la suscripción, las bibliotecas cliente insertan un atributo específico de seguimiento en el lado de la publicación. El mecanismo de propagación del contexto solo se habilita cuando se activa el seguimiento y se antepone con el prefijo googclient_.
Publica mensajes con seguimiento
En la siguiente muestra de código, se muestra cómo habilitar el registro de seguimiento con la biblioteca cliente de Pub/Sub y el SDK de OpenTelemetry. En este ejemplo, los resultados del seguimiento se exportan a Cloud Trace.
Consideraciones
Cuando creas una instancia del proveedor de Tracer, configuras una proporción de muestreo con el SDK de OpenTelemetry. Esta proporción determina cuántos registros debe muestrear el SDK. Una tasa de muestreo más baja puede ayudarte a reducir los costos de facturación y evitar que tu servicio supere la cuota de intervalos de Cloud Trace.
Go
C++
Python
Antes de probar esta muestra, sigue las instrucciones de configuración de Python en la guía de inicio rápido sobre el uso de bibliotecas cliente. Si quieres obtener más información, consulta la documentación de referencia de la API de Pub/Sub para Python.
TypeScript
Node.js
Java
Recibe mensajes con seguimiento
Go
C++
Python
TypeScript
Node.js
Java
Cómo analizar un registro
En las siguientes secciones, se incluye información detallada sobre cómo hacer un seguimiento de un registro y analizarlo en la consola de Google Cloud .
Consideraciones
- Cuando se publica un lote de mensajes, el intervalo de RPC de publicación se captura en un registro de seguimiento independiente.
- Una RPC de publicación tiene varios intervalos de origen, ya que varias llamadas de creación pueden generar una RPC de publicación cuando se agrupan por lotes.
Los intervalos en OpenTelemetry pueden tener cero o un intervalo principal.
Los intervalos que representan operaciones por lotes, como un lote de publicación (que, lógicamente, debería tener varios elementos superiores), no se pueden representar con cero o un intervalo superior.
Segmentos de seguimiento creados durante el ciclo de vida del mensaje
En la siguiente imagen, se muestra un ejemplo de los intervalos que se crean en un solo registro para un solo mensaje.
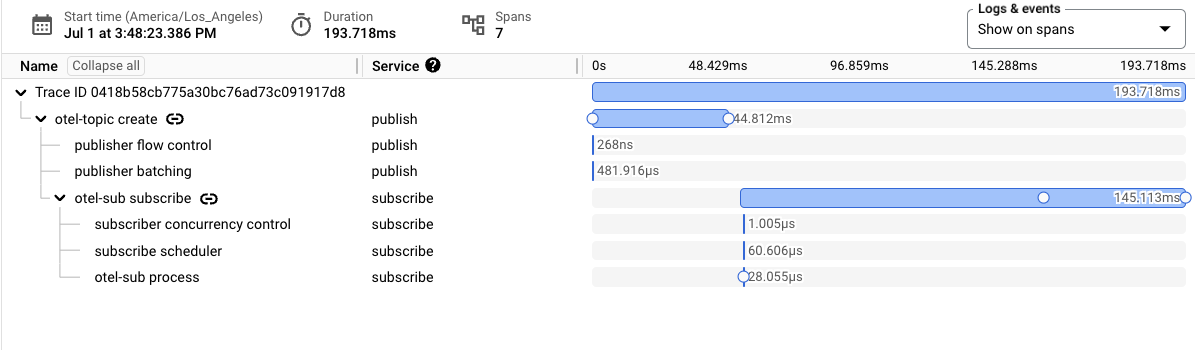
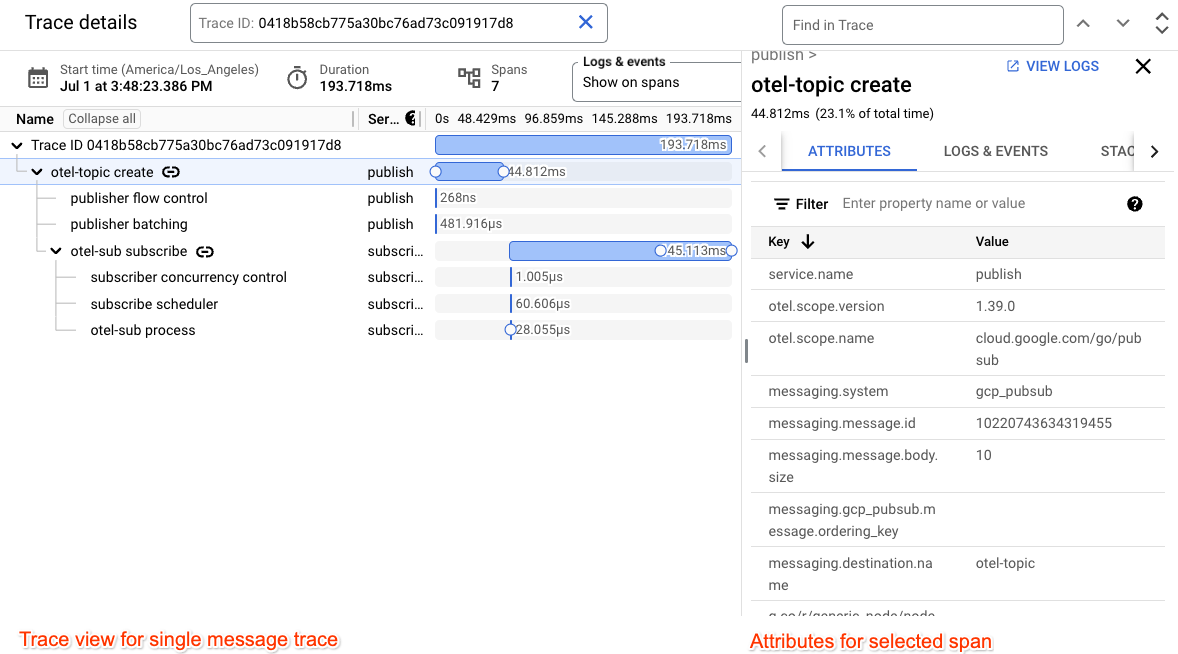
Cada tramo puede tener atributos adicionales. Los atributos del tramo transmiten metadatos adicionales, como la clave de ordenamiento, el ID y el tamaño del mensaje.
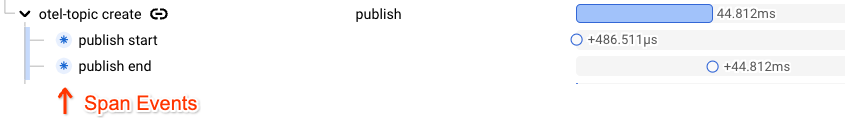
Los intervalos principales de publicación y suscripción se aumentan con eventos de intervalo que corresponden a cuando se emite una llamada de red y cuando se completa.
Soluciona los problemas comunes.
Los siguientes problemas pueden causar inconvenientes con el registro de seguimiento:
- La cuenta de servicio que usas para exportar los registros no tiene el rol
roles/cloudtrace.agentrequerido. - Se alcanzó la cuota de la cantidad máxima de intervalos transferidos en Cloud Trace.
- Tu aplicación se cierra sin llamar a la función de vaciado adecuada.