OpenTelemetry tracing lets you identify and trace the latency of various Pub/Sub client library operations, such as batching, lease management, and flow control. Collecting this information can help you debug client library issues.
Some potential use cases for OpenTelemetry tracing include the following:
- Your service is experiencing a higher publishing latency than normal.
- You are experiencing a high number of message redeliveries.
- A change to your subscriber client's callback function causes processing to take longer than usual.
Before you begin
Before configuring OpenTelemetry, complete the following tasks:
- Set up Pub/Sub using one of the client libraries.
- Install the OpenTelemetry SDK and set up a trace exporter and a tracer provider.
- Enable the Cloud Trace API.
- Understand how to read Cloud Observability traces.
Required roles
To ensure that the service account has the necessary permissions to export traces to Cloud Trace, ask your administrator to grant the service account the following IAM roles on your project:
-
All:
Cloud Trace Agent (
roles/cloudtrace.agent)
For more information about granting roles, see Manage access to projects, folders, and organizations.
These predefined roles contain the permissions required to export traces to Cloud Trace. To see the exact permissions that are required, expand the Required permissions section:
Required permissions
The following permissions are required to export traces to Cloud Trace:
-
All:
cloudtrace.traces.patch
Your administrator might also be able to give the service account these permissions with custom roles or other predefined roles.
OpenTelemetry tracing workflow
To set up OpenTelemetry tracing, you use the Pub/Sub client libraries and the OpenTelemetry SDK. With the SDK, you must set up a trace exporter and a tracer provider, before connecting to the Pub/Sub libraries. In some libraries, setting up a tracer provider is optional.
Trace exporter. The OpenTelemetry SDK uses the trace exporter to determine where to send traces.
Tracer provider. The Pub/Sub client libraries use the tracer provider to create traces.
The following steps outline how to set up tracing:
- Instantiate a Cloud Trace OpenTelemetry exporter.
- If required, instantiate and register a Tracer Provider using the OpenTelemetry SDK.
- Configure your client with the enable OpenTelemetry tracing option.
- Use the Pub/Sub client libraries to publish a message.
How tracing works
For every message published, the client library creates a new trace. This trace represents the entire lifecycle of the message, from the moment you publish a message to when the message is acknowledged. A trace encapsulates information such as the duration of operations, parent spans and children spans, and linked spans.
A trace is made up of a root span and its corresponding child spans. These spans represent the work the client library does when processing a message. Each message trace contains the following:
- For publishing. Flow control, ordering key scheduling, batching, and the length of the publish RPC.
- For subscriptions. Concurrency control, ordering key scheduling, and lease management.
In order to propagate information from the publish to subscribe side, the
client libraries inject a tracing specific attribute on the publish
side. The context propagation mechanism is only enabled when tracing is turned
on and is prepended with the googclient_ prefix.
Publish Messages with tracing
The following code sample shows you how to enable tracing by using the Pub/Sub client library and the OpenTelemetry SDK. In this sample, the tracing results are exported to Cloud Trace.
Considerations
When instantiating the tracer provider, you configure a sampling ratio with the OpenTelemetry SDK. This ratio determines how many traces the SDK should sample. A lower sampling rate can help reduce billing costs and prevent your service from exceeding the Cloud Trace span quota.
Go
C++
Python
Before trying this sample, follow the Python setup instructions in Quickstart: Using Client Libraries. For more information, see the Pub/Sub Python API reference documentation.
TypeScript
Node.js
Java
Receive messages with tracing
Go
C++
Python
TypeScript
Node.js
Java
Analyze a trace
The following sections contain detailed information about how to track and analyze a trace in the Google Cloud console.
Considerations
- When publishing a batch of messages, the publish RPC span is captured in a separate trace.
- A publish RPC has multiple origin spans, since multiple create calls can result in a publish RPC when they are batched together.
Spans in OpenTelemetry can have zero or one parent spans.
Spans representing batched operations, such a publish batch, (which logically should have multiple parents) can't be represented using zero or one parent spans.
Track spans created during the message lifecycle
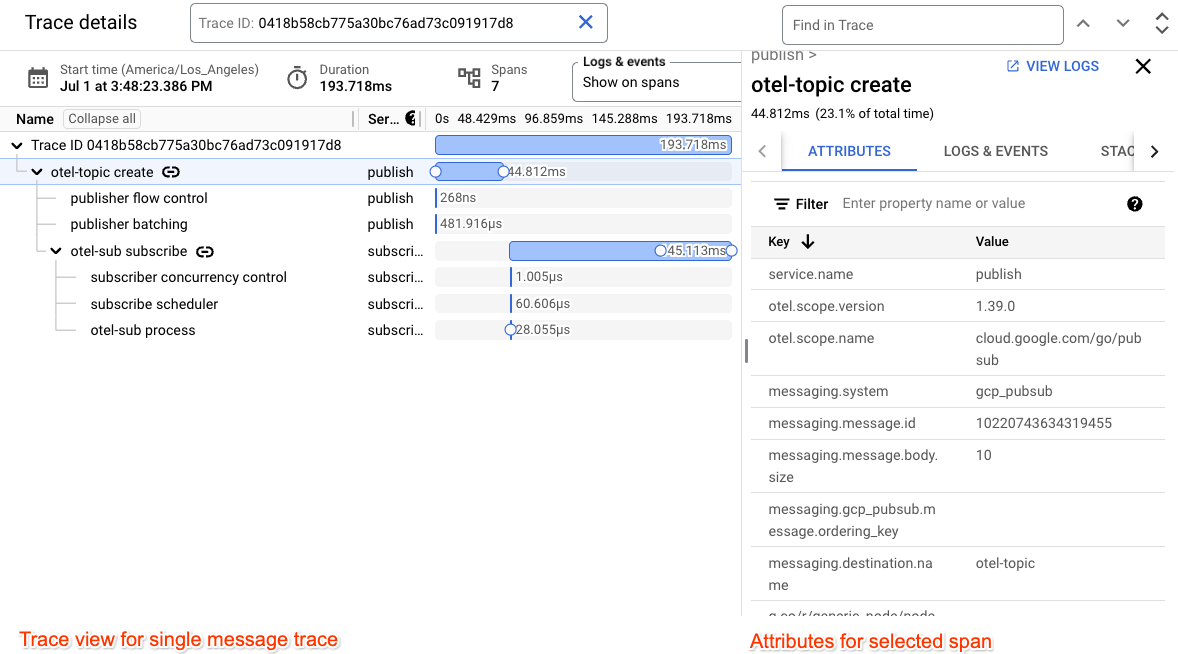
The following image shows an example of spans that are created in a single trace for a single message.

Each span can have additional attributes. Span attributes convey additional metadata such as the message's ordering key, the message ID, and the size of the message.

The main publish and subscribe spans are augmented with span events which correspond to when a network call is issued and when it is completed.

Troubleshoot common issues
The following issues can cause problems with tracing:
- The service account that you use for exporting traces doesn't have
the required
roles/cloudtrace.agentrole. - The quota of the maximum number of ingested spans in Cloud Trace has been reached.
- Your application is terminated without calling the appropriate flush function.
