Tetap teratur dengan koleksi
Simpan dan kategorikan konten berdasarkan preferensi Anda.
Tampilan performa Google Cloud memberikan tampilan performa
rata-rata untuk pasangan region atau zona yang dipilih. Anda dapat menggunakan tampilan performa Google Clouddi Network Intelligence Center di konsol Google Cloud untuk merencanakan pengelolaan performa aplikasi Anda. Tampilan performa Google Cloud membantu Anda mengidentifikasi region dan zona terbaik untuk men-deploy resource baru atau mengoptimalkan workload yang ada. Misalnya, Anda saat ini berjalan di zona dan region tertentu, tetapi Anda tahu bahwa zona dan region tersebut diakses oleh pengguna atau beban kerja lain dari region lain.
Skenario: Memahami performa di zona dan wilayah baru
Anda ingin menambahkan beban kerja ke region, dan ingin mengetahui zona mana yang paling sesuai dengan kebutuhan Anda.
Anda menggunakan menu pemilihan region sumber dan tujuan untuk memilih
pasangan sumber-tujuan tempat Anda ingin melihat metrik rata-rata global untuk
latensi atau paket yang hilang.
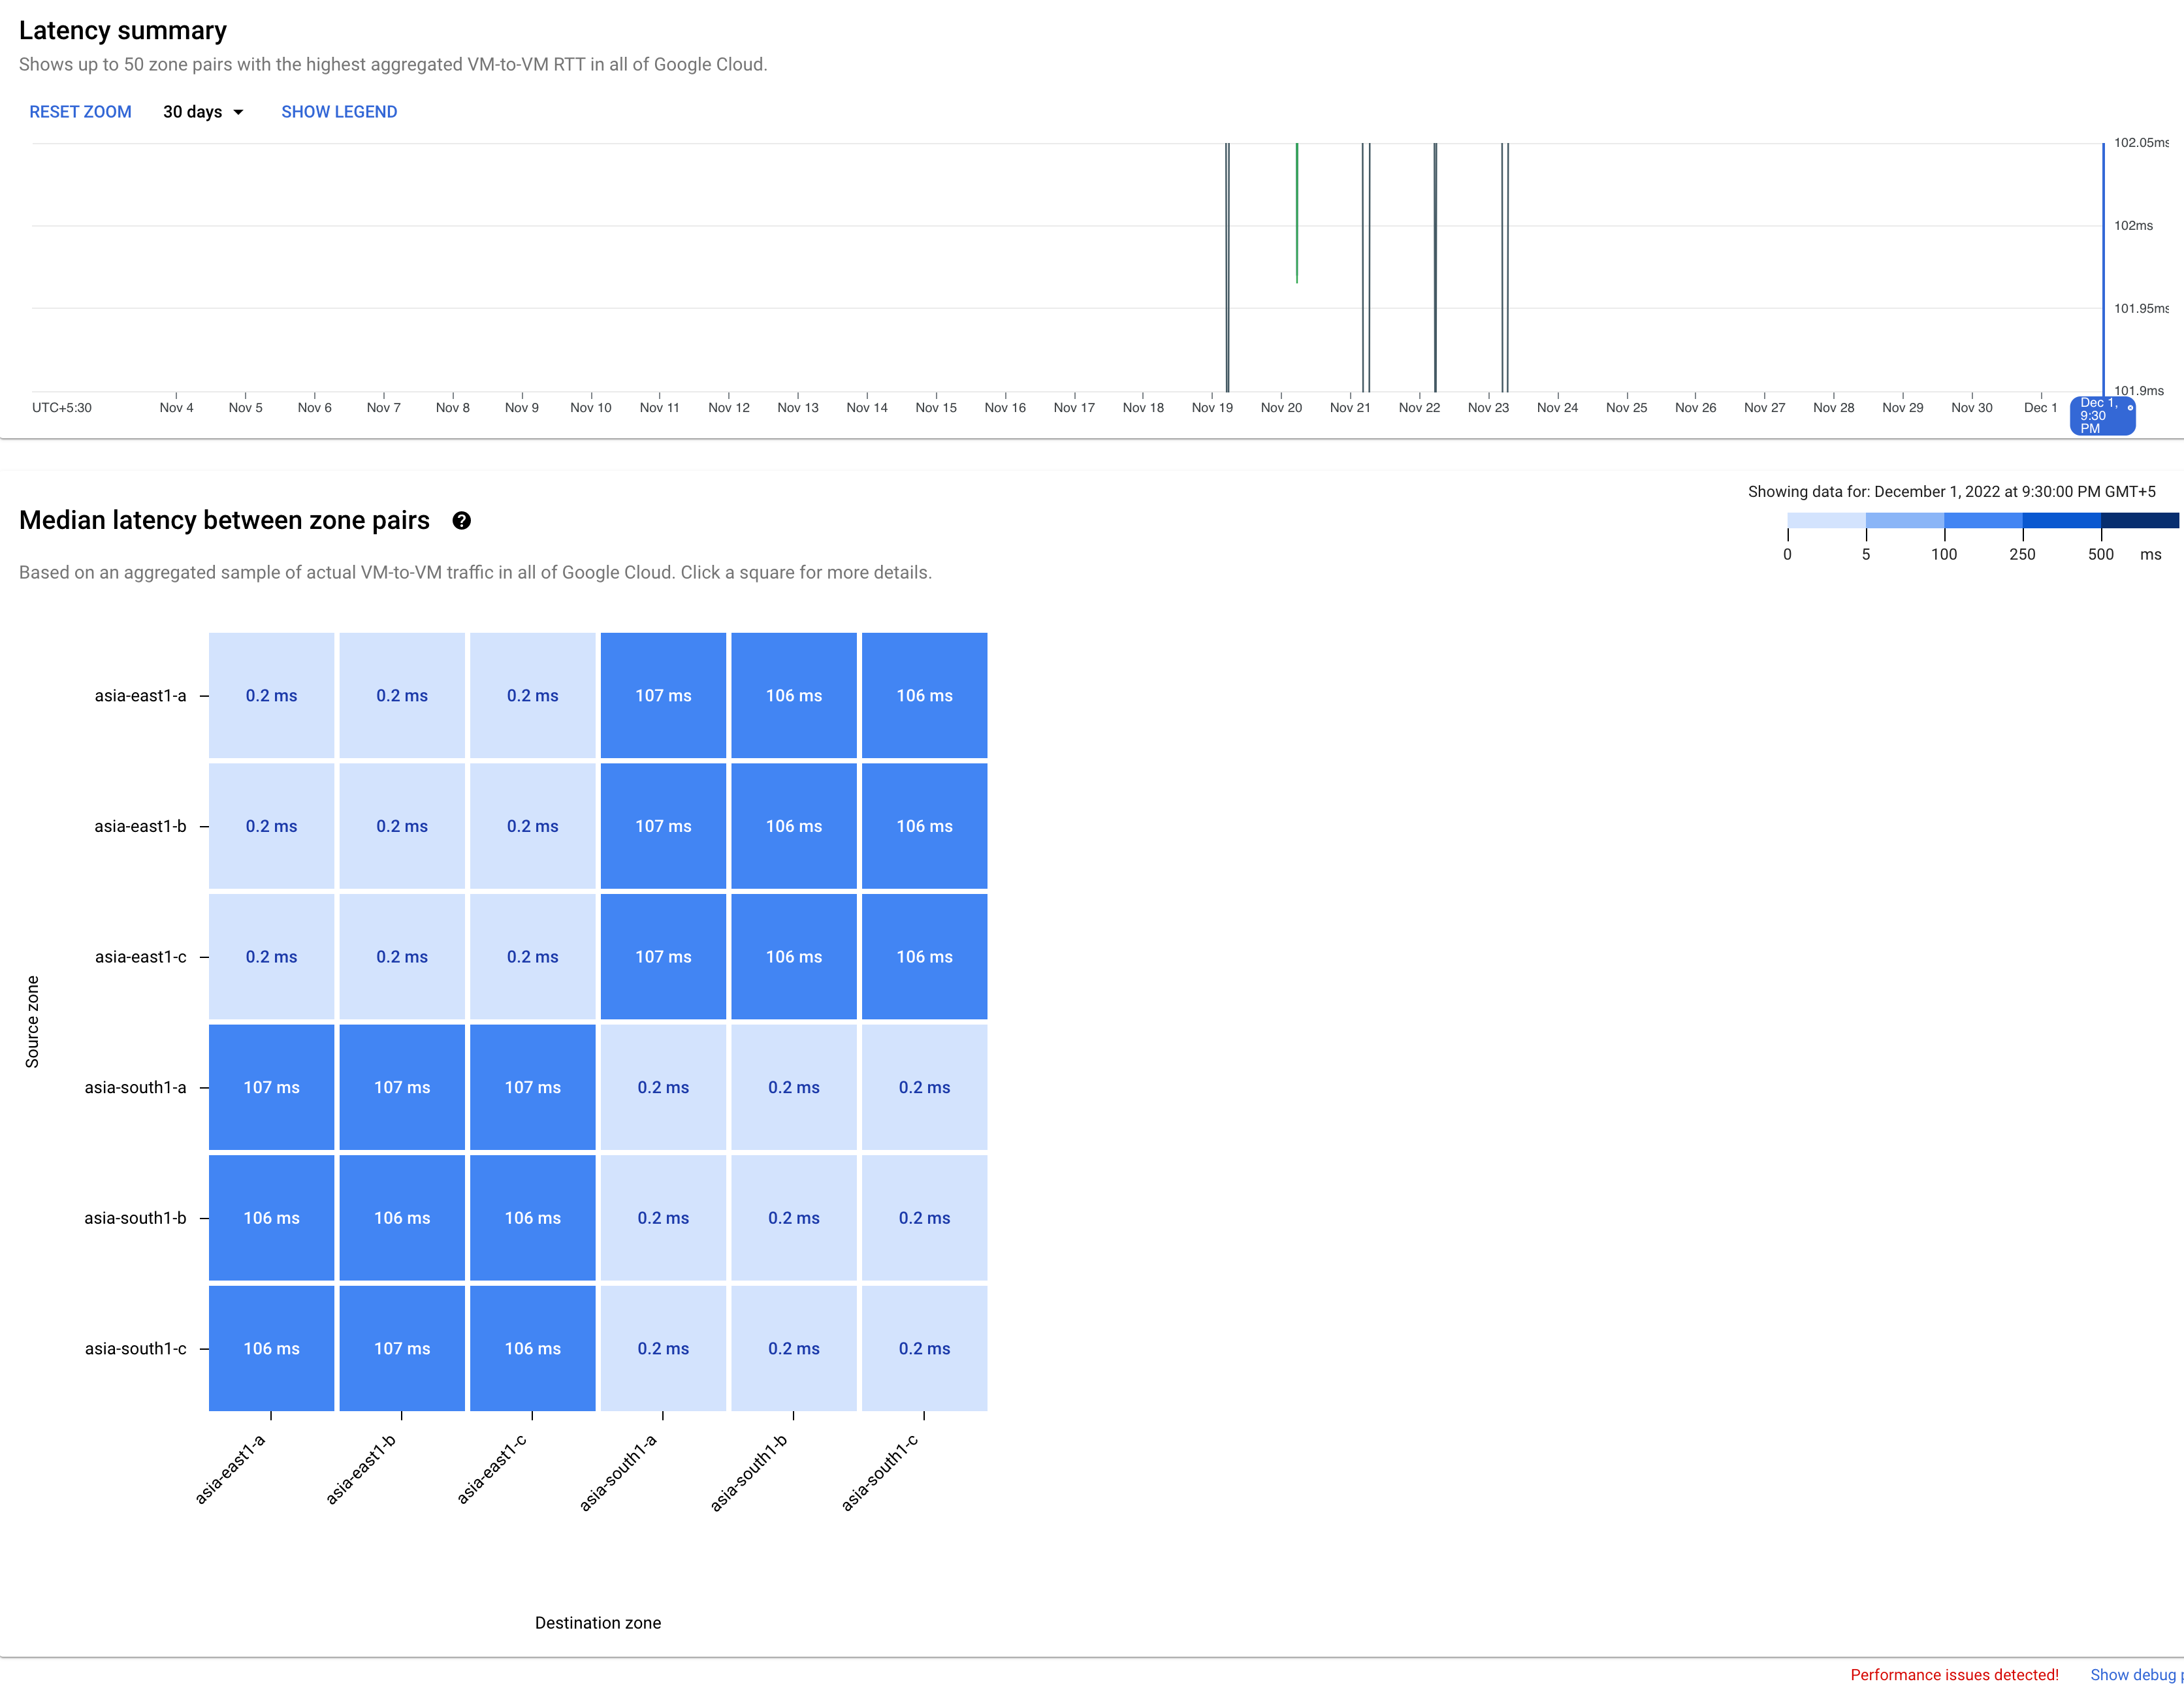
Untuk melihat zona dalam pasangan region, Anda memilih pasangan region dari peta panas.
Dalam contoh ini, Anda mengklik kotak peta panas untuk pasangan wilayah
asia-east1 dan asia-south1, lalu menyesuaikan pemilih waktu ke 30 hari.
Peta panas pasangan region kehilangan paket (klik untuk memperbesar)
Skenario: Melihat data historis untuk pasangan region atau zona
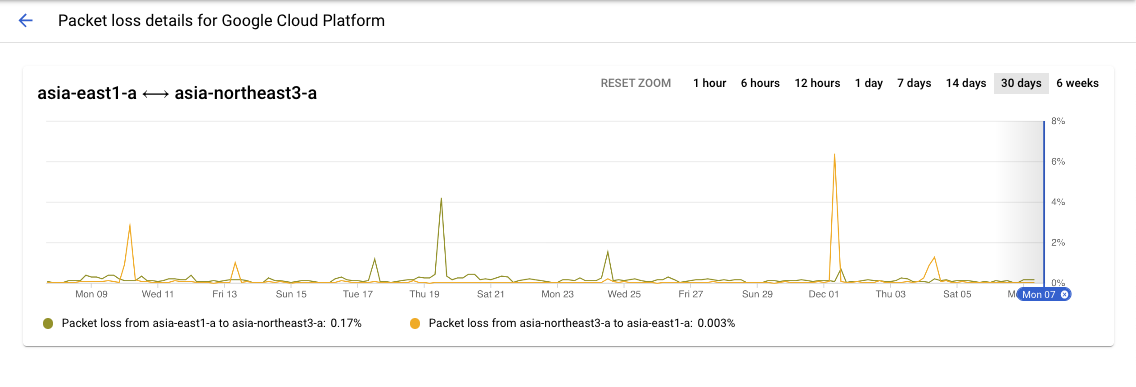
Gunakan kemampuan diagram deret waktu untuk menampilkan data historis untuk
pasangan zona yang dipilih. Dalam contoh ini, Anda dapat melihat kotak peta panas untuk pasangan zona
asia-east1-a dan asia-northeast3-a serta pemilih waktu yang disesuaikan menjadi 30
hari.
Data historis pasangan zona (klik untuk memperbesar)
[[["Mudah dipahami","easyToUnderstand","thumb-up"],["Memecahkan masalah saya","solvedMyProblem","thumb-up"],["Lainnya","otherUp","thumb-up"]],[["Sulit dipahami","hardToUnderstand","thumb-down"],["Informasi atau kode contoh salah","incorrectInformationOrSampleCode","thumb-down"],["Informasi/contoh yang saya butuhkan tidak ada","missingTheInformationSamplesINeed","thumb-down"],["Masalah terjemahan","translationIssue","thumb-down"],["Lainnya","otherDown","thumb-down"]],["Terakhir diperbarui pada 2025-09-08 UTC."],[],[],null,["# Planning for performance use cases\n\nThe Google Cloud performance view provides an average performance\nview for selected region or zone pairs. You can use the Google Cloud\nperformance view in the Network Intelligence Center in the Google Cloud console to plan the\nperformance management of your applications. The Google Cloud performance\nview helps you to identify the best regions and zones to deploy new resources or\nto optimize your existing workloads. For example, you are currently running in\nspecific zones and regions, but you know they are accessed by users or other\nworkloads from other regions.\n\n### Scenario: Understand performance in new zones and regions\n\nYou want to add workloads to a region, and you want to know which zone best\nserves your requirements.\n\nYou use the source and destination region selection menu to select\nsource-destination pairs where you want to see the global average metrics for\nlatency or packet loss.\n\nTo view the zones within a region pair, you select the region pair from the heatmap.\nIn this example, you clicked the heatmap square for the region pair\n`asia-east1` and `asia-south1` and adjusted the time selector to 30 days.\n[](/static/network-intelligence-center/docs/performance-dashboard/images/gcpd-pl-sum-hm-blue.png) Packet loss region pair heatmap (click to enlarge)\n\n### Scenario: View historical data for regions or zone pairs\n\nUse the time series chart capability to display historical data for selected\nzone pairs. In this example, you can see the heatmap square for the zone pair\n`asia-east1-a` and `asia-northeast3-a` and the time selector adjusted to 30\ndays.\n[](/static/network-intelligence-center/docs/performance-dashboard/images/gpd-pl-dets-zonepairs.png) Zone pairs historical data (click to enlarge)\n\nWhat's next\n-----------\n\n- [Project performance use cases](/network-intelligence-center/docs/performance-dashboard/concepts/use-cases-project)\n- [Planning for performance across geographies use cases](/network-intelligence-center/docs/performance-dashboard/concepts/use-cases-performance-across-geographies)\n- [View project-specific packet loss dashboard](/network-intelligence-center/docs/performance-dashboard/how-to/view-project-specific-packet-loss)\n- [View Google Cloud packet loss dashboard](/network-intelligence-center/docs/performance-dashboard/how-to/view-google-cloud-packet-loss)\n- [Troubleshoot Performance Dashboard](/network-intelligence-center/docs/performance-dashboard/support/troubleshooting)"]]