Use case: Troubleshoot network connectivity
In this use case, you're a network administrator supporting a network that includes several load-balanced applications. You've been alerted of a latency problem and have been told that your organization's mobile application is intermittently slow and timing out. You know that a number of different users are affected, and that there have been no recent application deployments. The issue is likely related to a change in the environment and not the application.
The following use case demonstrates how Network Topology can help you quickly troubleshoot and investigate issues in your deployment.
Topology details
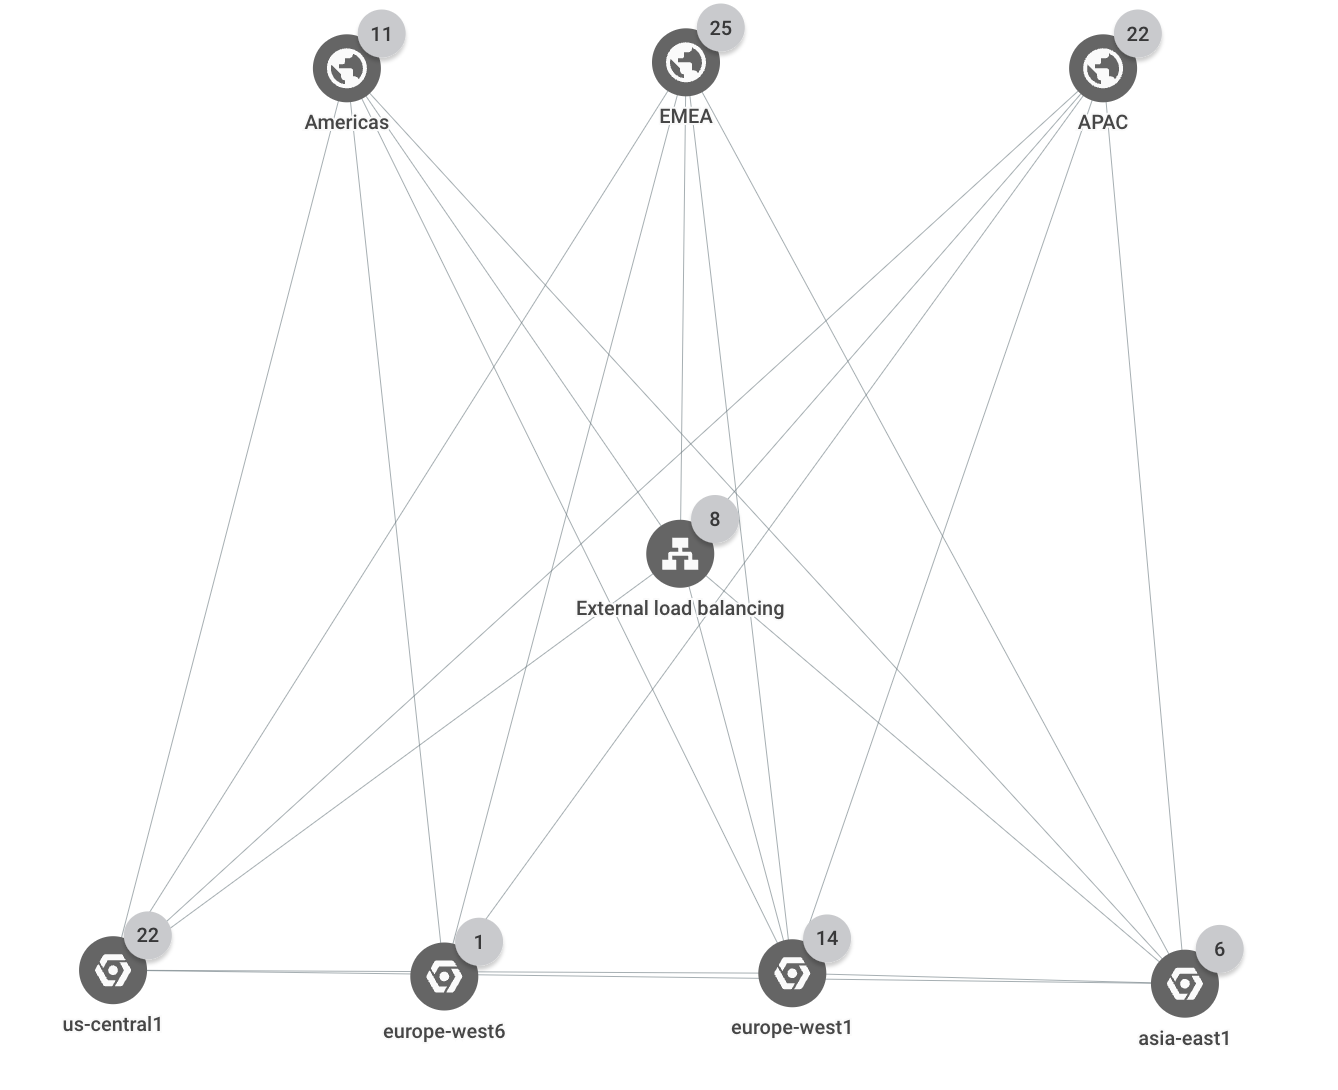
The deployment spans three Google Cloud regions (us-central1,
europe-west1, and asia-east1). All external client requests are served by a
single external Application Load Balancer that has multiple backends in each of the three
regions. Client requests that come from one of three business regions (Americas,
EMEA, and APAC) are served by application instances in the closest
Google Cloud region.
The following topology shows the top-level hierarchy for the deployment:
Network latency
In this scenario, assume that you have a load balancer named shopping-site-lb.
You check the latency between external clients and the load balancer to see if
the latency between them has changed. You discover that it has and decide to
further investigate the load balancer's backends.
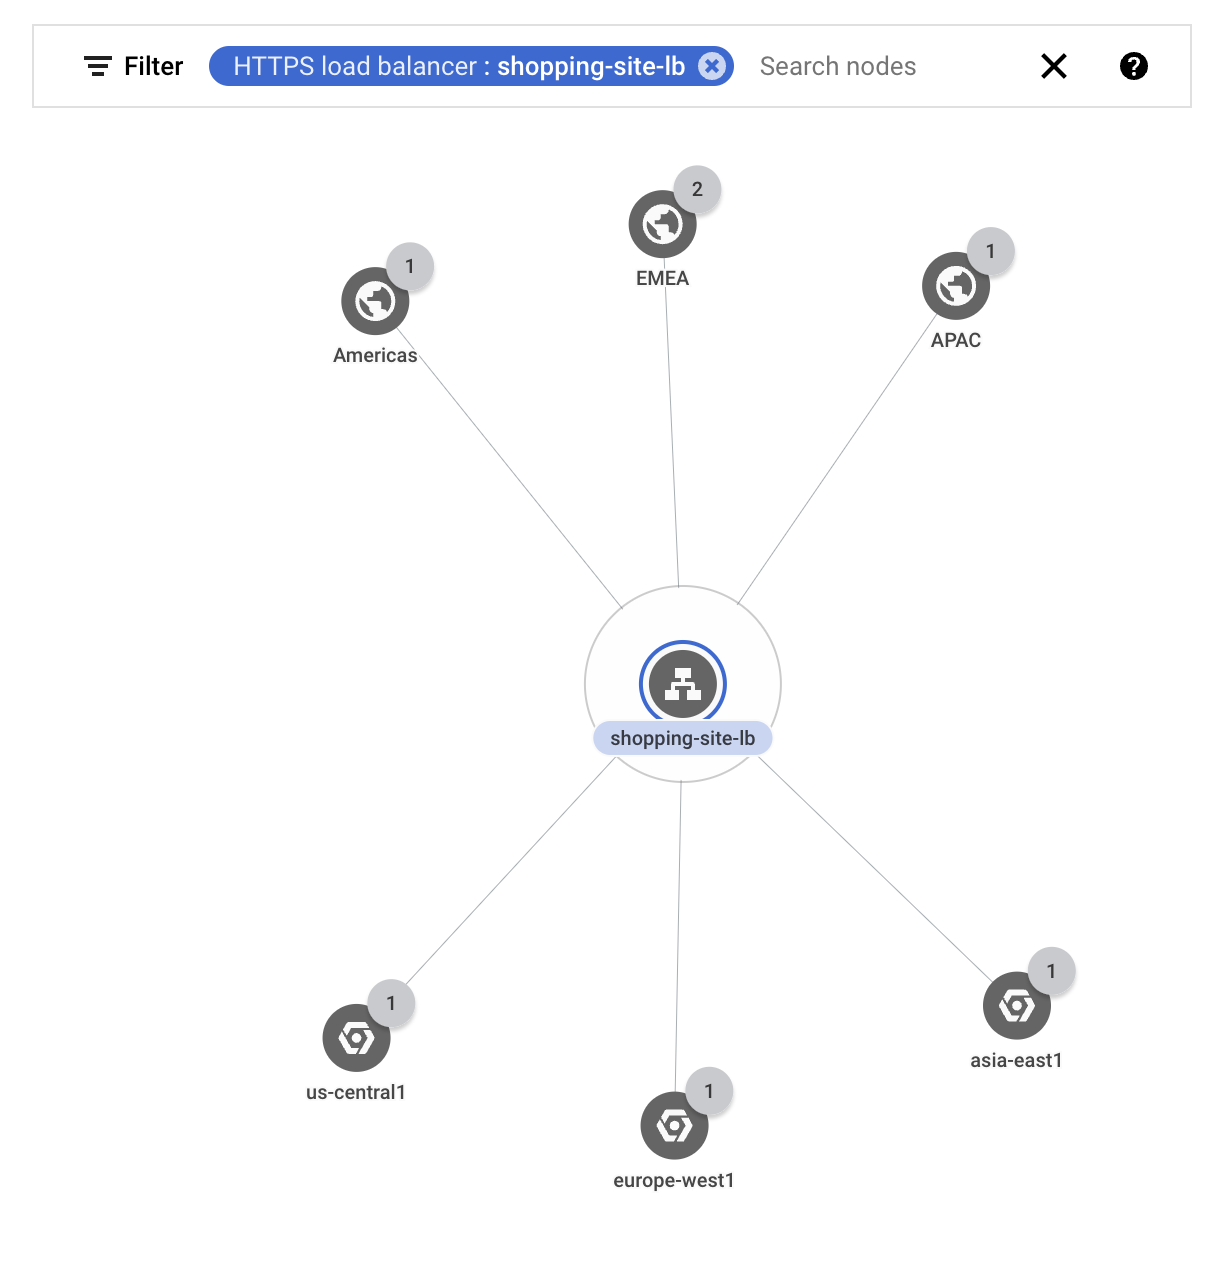
You filter the topology to show only the traffic for your external load balancer
shopping-site-lb.After you apply the filter, Network Topology shows only the connections related to the load balancer, as shown in the following example.
Starting with the external clients in Americas, you click the traffic metrics between the Americas business region and the load balancer.
Network Topology shows charts in the details pane. The information includes ingress and egress traffic between your selected entity and the connected entity. For example, Network Topology provides the latest values for queries per second (QPS) and the HTTP request latency.
In the request latency chart, you see values for the 50th, 95th, and 99th percentiles. In this example, assume that all of the latency values are higher than you expected.
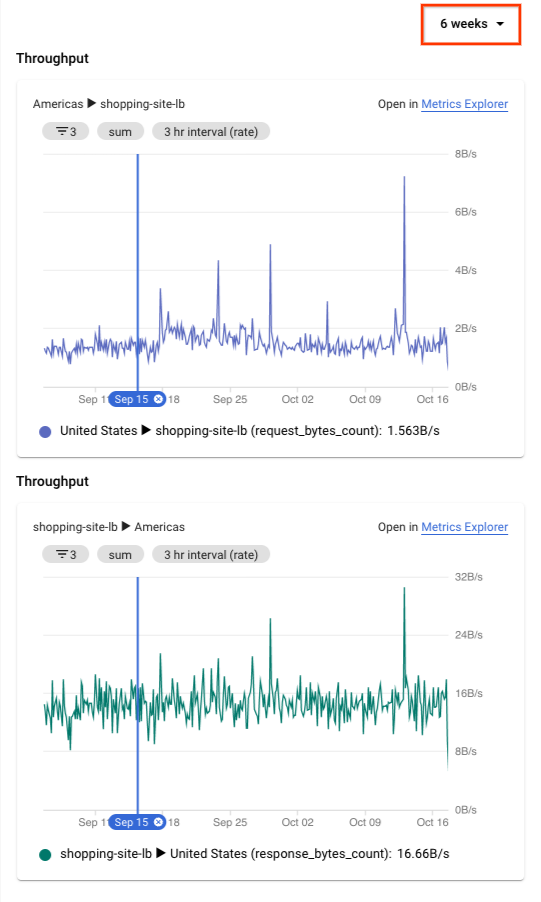
To expand the time series charts to 6 weeks, at the top of the details pane, you select 6 weeks.
1The figure is for reference. Its data doesn't reflect the use case.
You see a significant jump that happened about two hours ago, roughly when the first issues were reported. You're confident that the issue is related to increased latency with the load balancer.
Having a high-level view of the issue, you investigate the load balancer further by going to the Load balancing page in the Google Cloud console. You eventually find that an instance in the load balancer's backend service was taking longer than normal to respond. You take that instance out of service, which resolves the issue.
What's next
- Monitor your networking configuration with Network Topology
- Use case: Audit network performance
- Troubleshoot Network Topology