여러 부하 분산 애플리케이션이 포함된 네트워크를 지원하는 네트워크 관리자라고 가정하세요. 구성이 네트워크의 예상 상태와 일치하도록 하기 위해 해당 애플리케이션을 지원하는 네트워크 구성을 감사하라는 요청을 받았습니다. 이 감사를 수행하면 고객이 애플리케이션에 대해 가능한 가장 낮은 지연 시간을 확보할 수 있습니다.
다음 사용 사례는 네트워크 토폴로지가 기존 구성을 확인하는 데 어떻게 도움이 되는지 보여줍니다. 예를 들어 모든 클라이언트 요청이 클라이언트와 가장 가까운 Google Cloud리전의 애플리케이션 인스턴스에서 제공되고 있음을 확인할 수 있습니다. 또한 트래픽이 전역적으로 데이터를 복제하는 데이터베이스에서 발생하기 때문에 교차 리전 트래픽이 적다는 것을 확인할 수 있습니다.
토폴로지 개요
배포는 Google Cloud 리전 세 개(us-central1,
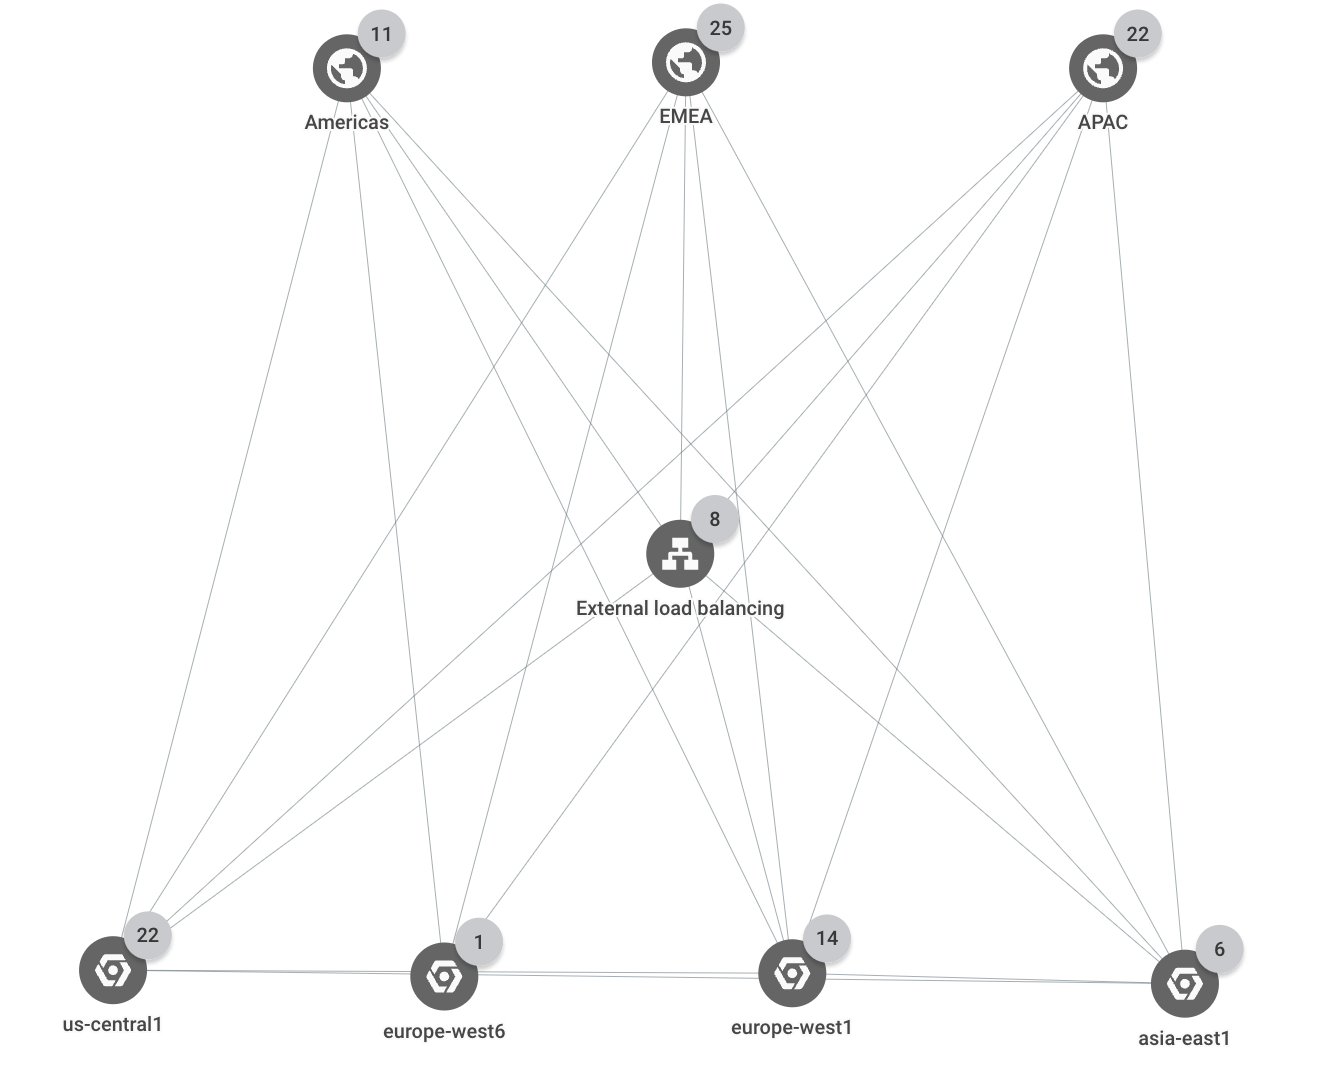
europe-west1, asia-east1)에 걸쳐 있습니다. 모든 외부 클라이언트 요청은 리전 세 개 각각에 백엔드가 여러 개 있는 단일 외부 애플리케이션 부하 분산기에서 처리됩니다. 3개의 비즈니스 리전(미주, EMEA, APAC) 중 하나에서 온 클라이언트 요청은 가장 가까운Google Cloud 리전의 애플리케이션 인스턴스에서 제공됩니다.
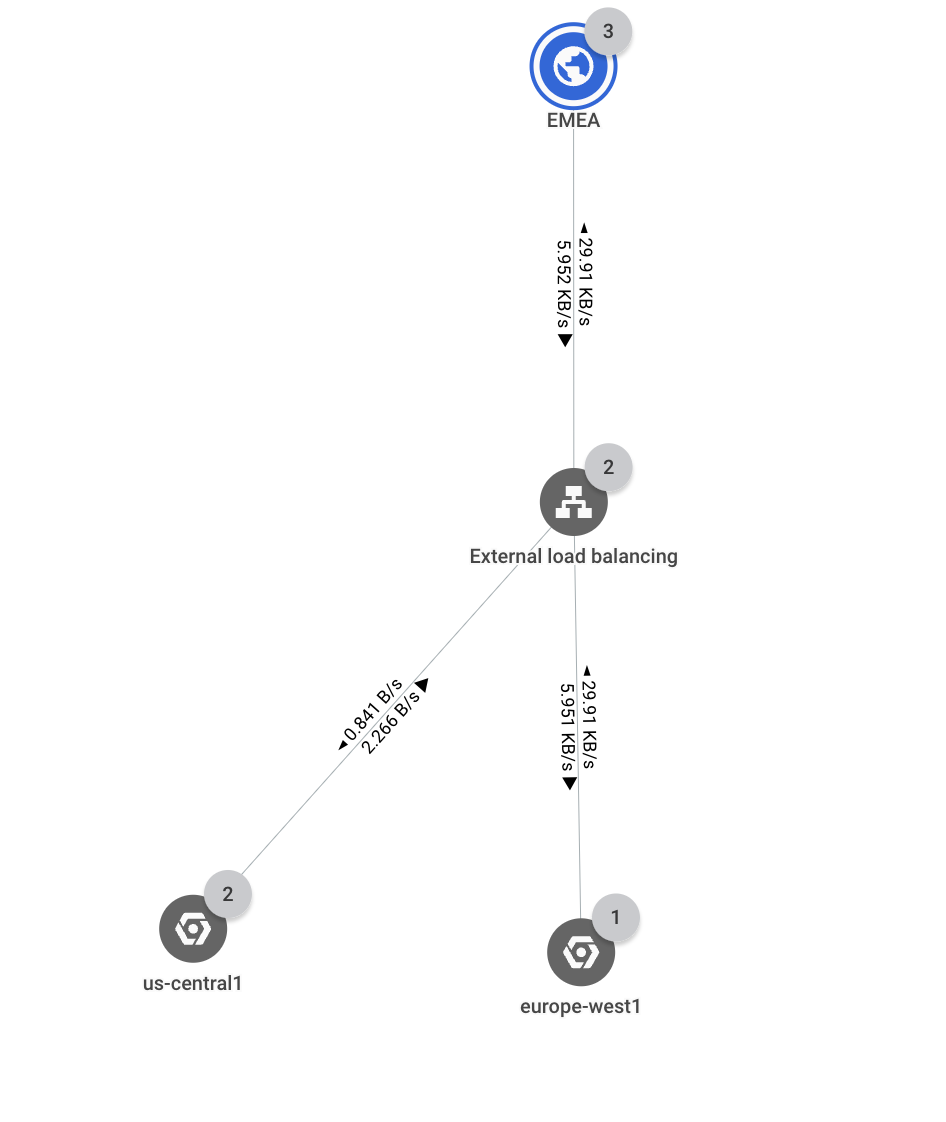
다음 그래프에서는 배포의 최상위 계층 구조를 보여줍니다.
네트워크 토폴로지 예시 토폴로지(확대하려면 클릭)
리소스 및 트래픽 경로
이 예시에서 프로젝트에는 다음과 같은 Google Cloud리소스가 포함됩니다.
HTTP(S) 부하 분산기
백엔드 서비스 4개: browse, shopping_cart, checkout, feeds
인스턴스 그룹 12개(부하 분산기 백엔드)
리전 세 개 각각에 백엔드 서비스마다 인스턴스 그룹 하나가 있습니다.
각 리전마다 하나씩 데이터베이스 인스턴스 3개
특정 국가의 트래픽은 다음 위치로 이동합니다.
Americas 비즈니스 리전의 국가에서 발생한 트래픽은 us-central1 리전의 백엔드로 이동합니다. 예를 들어, 캐나다의 외부 클라이언트로부터의 트래픽은 부하 분산기를 통해 us-central1 리전의 checkout 백엔드로 이동합니다.
EMEA 비즈니스 리전의 국가에서 발생한 트래픽은 europe-west1 리전의 백엔드로 이동합니다. 예를 들어, 폴란드의 외부 클라이언트로부터의 트래픽은 부하 분산기를 통해 europe-west1 리전의 checkout 백엔드로 이동합니다.
APAC 비즈니스 리전의 국가에서 발생한 트래픽은 asia-east1 리전의 백엔드로 이동합니다. 예를 들어 일본의 외부 클라이언트에서 전송된 트래픽은 부하 분산기를 통해 asia-east1 리전에 있는 checkout 백엔드로 이동합니다.
데이터베이스 인스턴스로의 트래픽은 같은 리전의 백엔드에서 발생합니다. 예를 들어, asia-east1의 백엔드는 asia-east1의 데이터베이스 인스턴스로만 데이터를 보냅니다.
리전 간 트래픽은 데이터베이스 복제로 제한됩니다. 예를 들어, us-central1과 europe-west1 사이의 트래픽은 해당 리전의 데이터베이스 인스턴스 사이에서만 이동합니다.
예기치 않은 트래픽 흐름
이 시나리오에서는 EMEA 비즈니스 리전의 트래픽이 이제 서로 다른 두 개의 Google Cloud 리전(us-central1 및 europe-west1)으로 이동하고 있습니다. 네트워크 토폴로지를 사용하면 백엔드 중 하나가 과도하게 사용되었음을 알 수 있습니다.
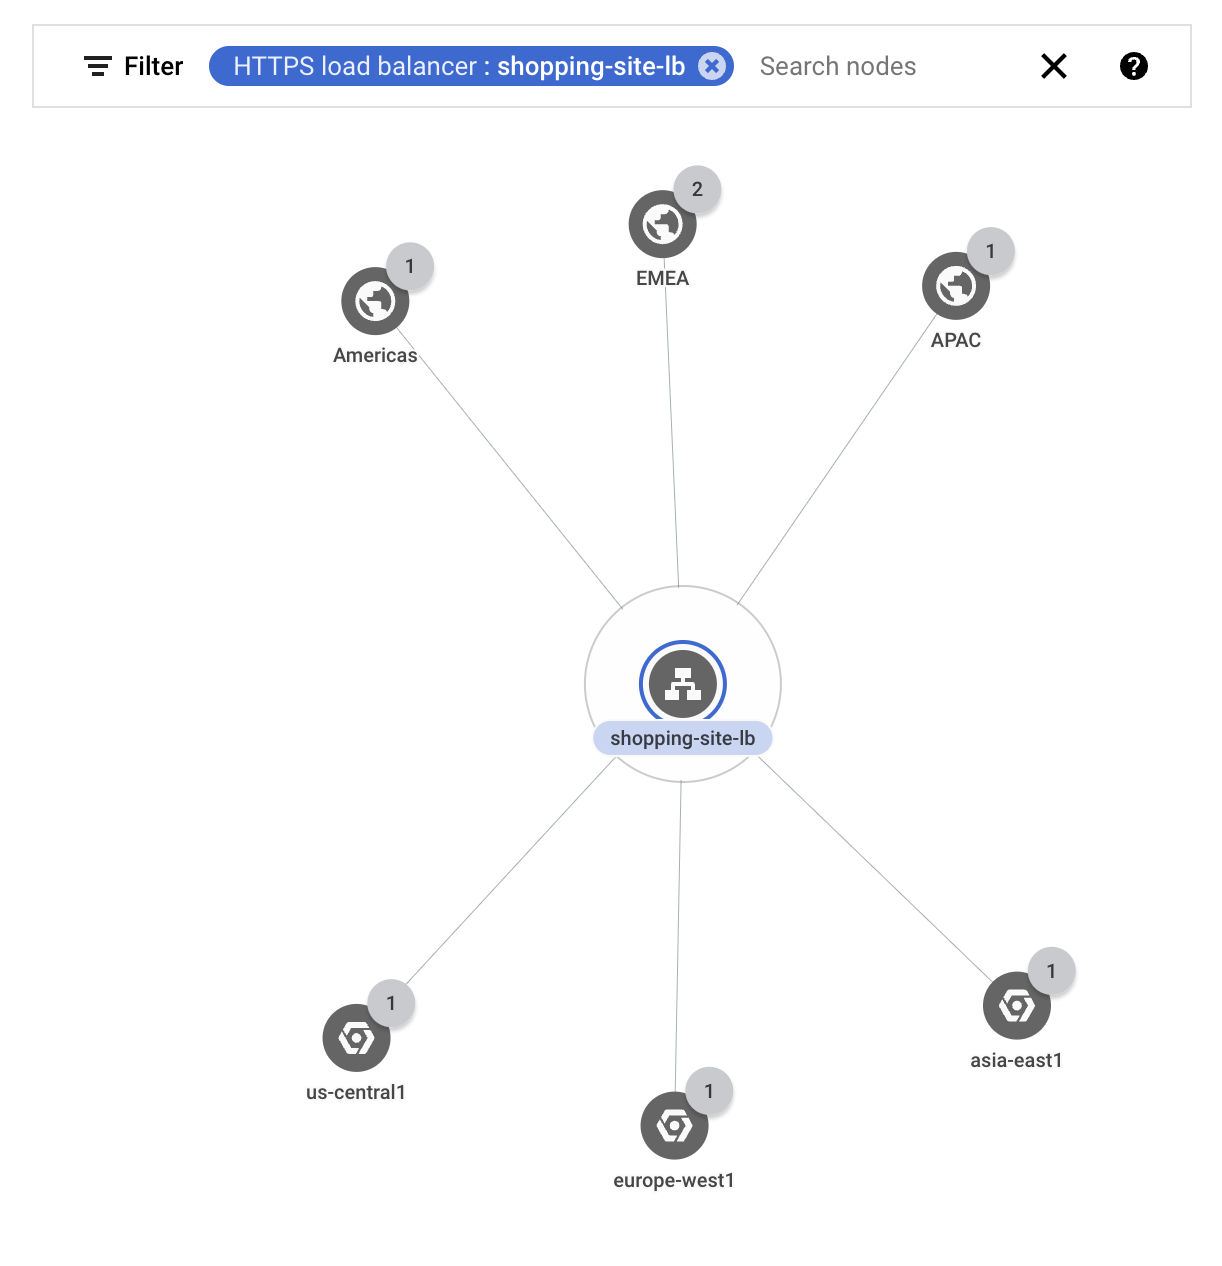
부하 분산기를 통과하는 외부 트래픽이 올바른 Google Cloud 리전으로 이동하는지 확인하려고 합니다. 외부 부하 분산기 shopping-site-lb에 대한 트래픽만 표시하도록 그래프를 필터링합니다.
필터를 적용하면 다음 예시와 같이 네트워크 토폴로지에 부하 분산기와 관련된 연결만 표시됩니다.
부하 분산기 필터(확대하려면 클릭)
각 비즈니스 리전 위에 마우스 포인터를 놓아 해당 리전과의 통신을 강조표시합니다.
미국 및 아시아 태평양 위에 마우스 포인터를 놓으면 가장 가까운 Google Cloud 리전(
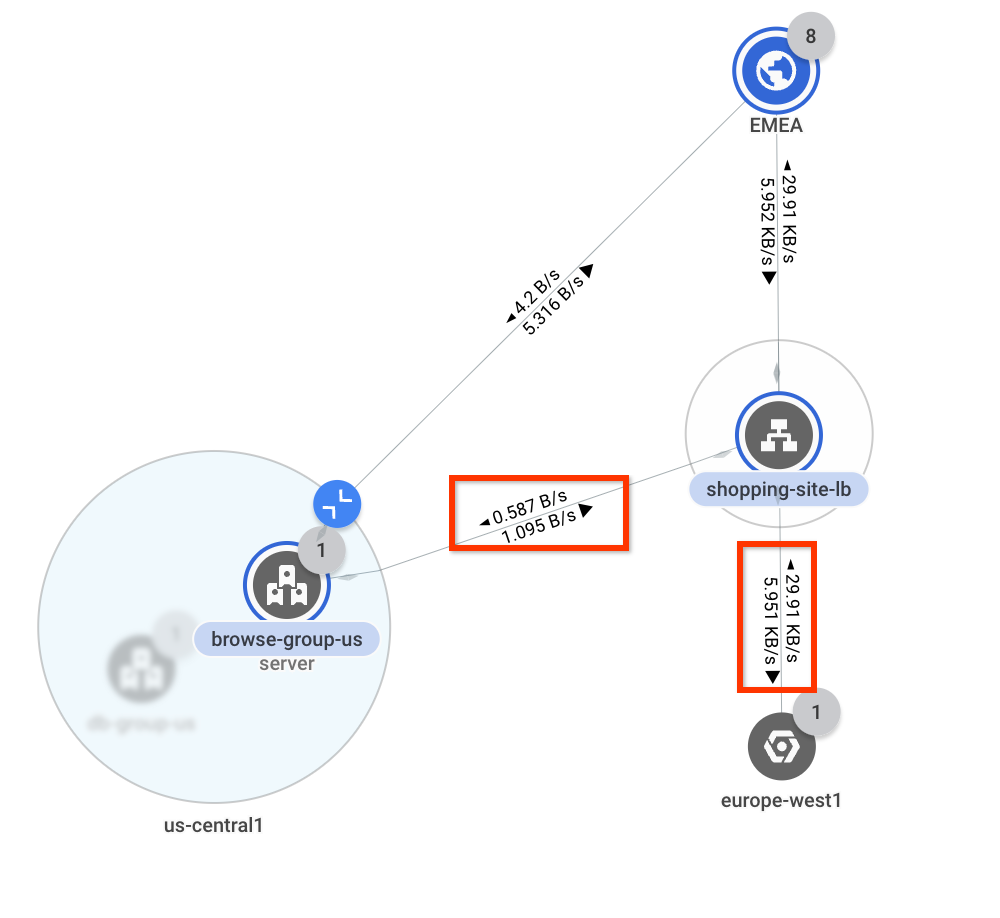
us-central1 및 asia-
east1)으로 트래픽이 이동하는 것을 볼 수 있습니다. 그러나 EMEA 위에 마우스 포인터를 놓으면 트래픽이 us-central1 및 europe-west1로 이동하는 것을 볼 수 있습니다. 지연 시간을 줄이려면 이상적으로 EMEA의 모든 트래픽이 europe-west1으로 이동해야 합니다.
다음으로 EMEA를 클릭하여 EMEA와Google Cloud 리전 간 처리량을 조사합니다. 네트워크 토폴로지는 각 연결에서 대역폭 값을 오버레이합니다. 초당 0.58바이트가 us-central1로 이동하고 초당 29.9킬로바이트가 europe-west1로 이동합니다. 대부분의 트래픽이 예상대로 전달되고 있지만 일부 트래픽이 us-central1로 흐르고 있음을 알고 있습니다.
오버레이된 대역폭 값1(확대하려면 클릭)
1그림은 참조용입니다. 데이터에는 사용 사례가 반영되어 있지 않습니다.
추가 조사를 위해 us-central1을 확장하여 트래픽이 이동하는 위치를 봅니다. 해당 리전에는 단일 서브넷이 있는 네트워크가 하나뿐이므로 네트워크 토폴로지는 해당 레벨의 계층 구조를 표시하지 않고 인스턴스 그룹으로 건너뜁니다.
트래픽이 부하 분산기의 백엔드 서비스와 연결된 인스턴스 그룹으로 이동하는 것을 볼 수 있습니다. 상대적으로 적은 양의 트래픽이 europe-west1로 이동하므로 europe-west1의 리소스가 과도하게 사용되어 트래픽이 us-central1로 오버플로될 수 있습니다.
트래픽 경로1(확대하려면 클릭)
1그림은 참조용입니다. 데이터에는 사용 사례가 반영되어 있지 않습니다.
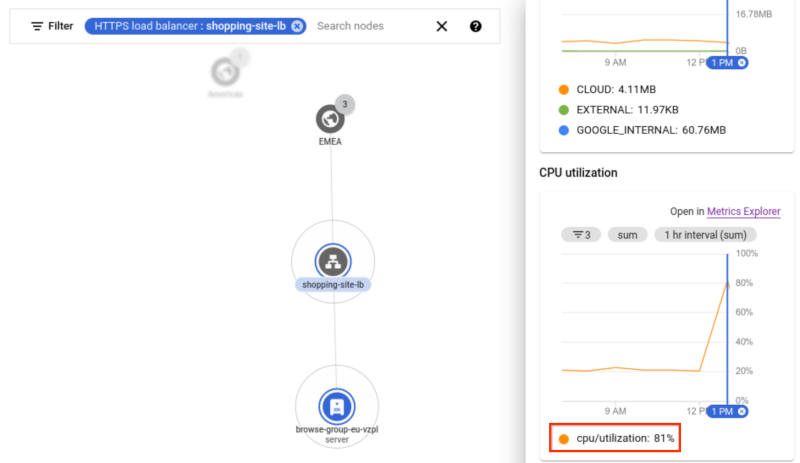
결론을 확인하려면 동일한 부하 분산기의 백엔드 서비스와 연관된 인스턴스에 도달할 때까지 europe-west1 리전을 확장하세요. 네트워크 토폴로지는 인스턴스의 세부정보 창에 시계열 차트를 표시합니다.
차트에서 인스턴스의 CPU 사용률은 81%입니다. 이 예시의 임곗값은 80%이므로 인스턴스가 초과 구독되었음을 나타냅니다. 트래픽이 이상적인 흐름으로 반환되도록 인스턴스 그룹을 확장하여 이 문제를 해결합니다.
인스턴스의 시계열 차트1(확대하려면 클릭)
1그림은 참조용입니다. 데이터에는 사용 사례가 반영되어 있지 않습니다.
리전 간 트래픽
다음 섹션에서는 리전 간 내부 트래픽이 데이터베이스 인스턴스 트래픽으로만 제한되어 있는지 확인합니다.
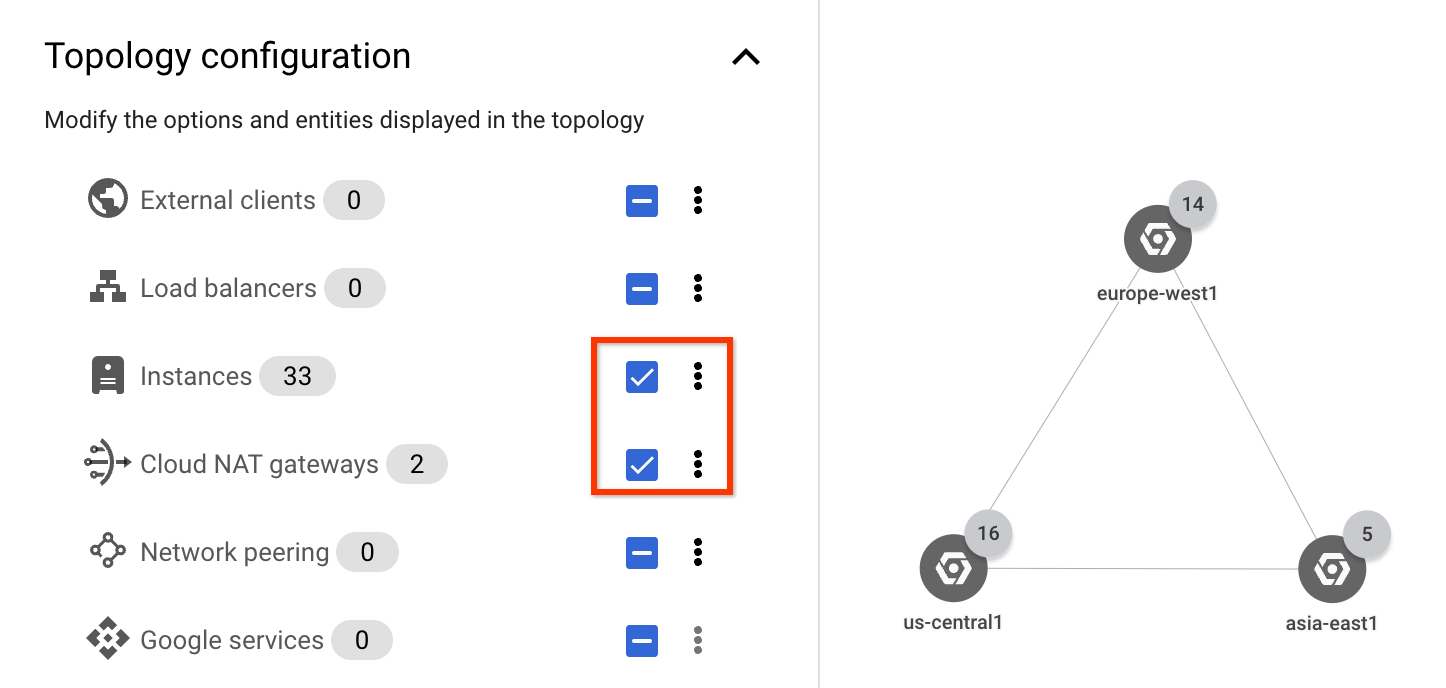
내부 트래픽에 집중하려면 토폴로지 구성 목록에서 인스턴스 및 Cloud NAT 게이트웨이 체크박스만 선택합니다. 애플리케이션 내에서만 트래픽을 보고 있으므로 외부 클라이언트와 외부 부하 분산기 트래픽을 확인할 필요가 없습니다.
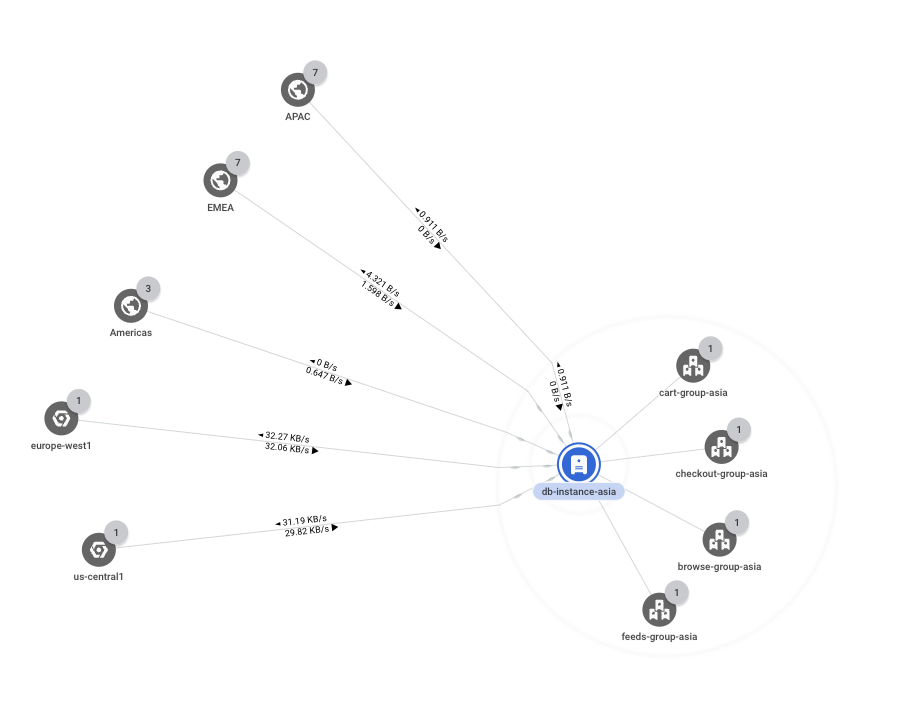
내부 전용 트래픽 표시(확대하려면 클릭)
asia-east1 리전을 확장하면 인스턴스 그룹 5개가 표시됩니다. 모두 동일한 네트워크, 서브넷 등에 있기 때문에 네트워크, 서브넷 또는 영역별로 집계되지 않습니다.
하나의 인스턴스 그룹(db-group-asia)에만 리전 간 트래픽 경로가 포함되어 있습니다. 다른 모든 인스턴스 그룹은 리전 내에서 통신하고 있습니다.
기본 항목에 도달할 때까지 db-group-asia 그룹을 계속 확장합니다. 이 시나리오에서 기본 항목은 데이터베이스 서버 역할을 하는 가상 머신(VM) 인스턴스(db-instance-asia)입니다. 예상대로 데이터를 복제하기 위해 다른 리전과 통신하고 있으므로 추가 조사가 필요하지 않습니다.
̦
[[["이해하기 쉬움","easyToUnderstand","thumb-up"],["문제가 해결됨","solvedMyProblem","thumb-up"],["기타","otherUp","thumb-up"]],[["이해하기 어려움","hardToUnderstand","thumb-down"],["잘못된 정보 또는 샘플 코드","incorrectInformationOrSampleCode","thumb-down"],["필요한 정보/샘플이 없음","missingTheInformationSamplesINeed","thumb-down"],["번역 문제","translationIssue","thumb-down"],["기타","otherDown","thumb-down"]],["최종 업데이트: 2025-09-04(UTC)"],[],[],null,["# Use case: Audit network performance\n===================================\n\nAssume that you're a network administrator who supports a network that includes\nseveral load-balanced applications. You've been asked to audit the network\nconfigurations that support those applications to ensure that the configurations\nare consistent with the expected state of your network. By doing this audit, you\ncan ensure that customers are getting the lowest possible latency to your\napplications.\n\nThe following use case demonstrates how Network Topology can help you\ncheck your existing configurations. For example, you can check that all client\nrequests are being served by application instances from the Google Cloud\nregion that's closest to the client. You can also ensure that cross-region\ntraffic is low because that traffic comes from databases that replicate data\nglobally.\n\nTopology overview\n-----------------\n\nThe deployment spans three Google Cloud regions (`us-central1`,\n`europe-west1`, and `asia-east1`). All external client requests are served by a\nsingle external Application Load Balancer that has multiple backends in each of the three\nregions. Client requests that come from one of three business regions (Americas,\nEMEA, and APAC) are served by application instances in the closest\nGoogle Cloud region.\n\nThe following graph shows the top-level hierarchy for the deployment.\n[](/static/network-intelligence-center/docs/network-topology/images/use-cases/auditing-topology.png) Network Topology example topology (click to enlarge)\n\n### Resources and traffic paths\n\nIn this example, the project contains the following Google Cloud\nresources:\n\n- 1 HTTPS load balancer\n\n- 4 backend services: `browse`, `shopping_cart`, `checkout`, and `feeds`\n\n- 12 instance groups (which are the load balancer's backends)\n\n There is one instance group for each backend service in each of the three\n regions.\n- 3 database instances, one in each region\n\nYou expect that traffic from certain countries goes to the following\nlocations:\n\n- Traffic from countries in the `Americas` business region goes to backends in the `us-central1` region. For example, traffic from an external client in Canada travels through the load balancer to the `checkout` backend in the `us-central1` region.\n- Traffic from countries in the `EMEA` business region goes to backends in the `europe-west1` region. For example, traffic from an external client in Poland travels through the load balancer to the `checkout` backend in the `europe-west1` region.\n- Traffic from countries in the `APAC` business region goes to backends in the `asia-east1` region. For example, traffic from an external client in Japan travels through the load balancer to the `checkout` backend in the `asia-east1` region.\n- Traffic to a database instance comes from a backend in the same region. For example, the backends in `asia-east1` send data only to the database instance in `asia-east1`.\n- Cross-region traffic is limited to database replication. For example, traffic between `us-central1` and `europe-west1` travels only between database instances in those regions.\n\nUnexpected traffic flow\n-----------------------\n\nIn this scenario, you discover that traffic from the `EMEA` business region\nis now going to two different Google Cloud regions, `us-central1` and\n`europe-west1`. By using Network Topology, you discover that one of\nthe backends is overutilized.\n\n1. You want to check that external traffic that is going through the load\n balancer eventually goes to the correct Google Cloud region. You filter\n the graph to show only the traffic for your external load balancer\n `shopping-site-lb`.\n\n After you apply the filter, Network Topology shows only the\n connections related to the load balancer, as shown in the following example.\n [](/static/network-intelligence-center/docs/network-topology/images/use-cases/auditing-filter.png) Filter for a load balancer (click to enlarge)\n2. You hold the pointer over each business region to highlight the communication\n to that region.\n\n When you hold the pointer over **Americas** and **APAC** , you see traffic\n going to the nearest Google Cloud region: `us-central1` and `asia-\n east1` respectively. However, when you hold the pointer over **EMEA** , you\n see traffic going to `us-central1` and `europe-west1`. Ideally, to reduce\n latency, all traffic from EMEA should go to `europe-west1`.\n3. Next, you click **EMEA** to study the throughput between it and the\n Google Cloud regions. Network Topology overlays bandwidth\n values on each connection. You see that about 0.58 bytes per second is\n going to `us-central1` and 29.9 kilobytes per second is going\n to `europe-west1`. You know that most of the traffic is being directed as\n you would expect, but some traffic is flowing to `us-central1`.\n\n [](/static/network-intelligence-center/docs/network-topology/images/use-cases/auditing-bandwidth.png) Overlaid bandwidth values^1^ (click to enlarge) \n\n ^1^The figure is for reference. Its data doesn't reflect the use\n case.\n4. To investigate further, you expand `us-central1` to view where traffic is\n going. Because there's only one network with a single subnet in that region,\n Network Topology doesn't show those levels of the hierarchy and\n skips to the instance groups.\n\n You see that traffic is going to an instance group that's associated with the load\n balancer's backend service. Because it's a relatively small amount of traffic\n going to `europe-west1`, it's possible that resources in `europe-west1` are\n overutilized and causing traffic to overflow to `us-central1`.\n [](/static/network-intelligence-center/docs/network-topology/images/use-cases/auditing-traffic.png) Traffic path^1^ (click to enlarge) \n\n ^1^The figure is for reference. Its data doesn't reflect the use\n case.\n5. To confirm your conclusion, you expand the `europe-west1` region until you\n reach the instance that is associated with the same load balancer's backend\n service. Network Topology shows time-series charts in the details\n pane for the instance.\n\n In the chart, you notice that the CPU utilization rate is at 81% for the\n instance. The threshold for this example is 80%, indicating that the instance\n is oversubscribed. You resolve this issue by scaling up the instance group so\n that traffic returns to the ideal flow.\n [](/static/network-intelligence-center/docs/network-topology/images/use-cases/auditing-chart.png) Time-series chart for an instance^1^ (click to enlarge) \n\n ^1^The figure is for reference. Its data doesn't reflect the\n use case.\n\nInter-region traffic\n--------------------\n\nIn the following section, you check that internal traffic between regions\nis limited to only database instance traffic.\n\n1. To focus on internal traffic, in the **Topology configuration** list, you select\n only the **Instances** and **Cloud NAT gateways** checkboxes. Because you are only\n viewing traffic within your application, you don't need to see external clients\n and external load balancer traffic.\n\n [](/static/network-intelligence-center/docs/network-topology/images/use-cases/auditing-internalonly.png) Showing internal-only traffic (click to enlarge)\n2. You expand the `asia-east1` region, and you see five instance groups. They are\n not aggregated by network, subnet, or zone because\n they are all in the same network, subnet, and so on.\n\n You notice that only one instance group (`db-group-asia`) contains a path\n for inter-region traffic. All other instance groups are communicating within\n the region.\n\n You continue to expand the `db-group-asia` group until you reach the base\n entity. In this scenario, the base entity is a virtual machine (VM) instance\n (`db-instance-asia`) that acts as a database server. It's communicating with\n other regions to replicate data, which is what you expected, so no further\n investigations are required.\n ̦\n [](/static/network-intelligence-center/docs/network-topology/images/use-cases/auditing-dbtraffic.png) Inter-region traffic^1^ (click to enlarge) \n\n ^1^The figure is for reference. Its data doesn't reflect the\n use case.\n\n \u003cbr /\u003e\n\nWhat's next\n-----------\n\n- [Monitor your networking configuration with Network Topology](/network-intelligence-center/docs/network-topology/how-to/audit-troubleshoot-networking-issues)\n- [Use case: Troubleshoot network connectivity](/network-intelligence-center/docs/network-topology/concepts/troubleshooting-network-connectivity)\n- [Troubleshoot Network Topology](/network-intelligence-center/docs/network-topology/support/troubleshooting)"]]