Caso d'uso: controlla le prestazioni della rete
Supponiamo che tu sia un amministratore di rete che supporta una rete che include diverse applicazioni bilanciate in base al carico. Ti è stato chiesto di controllare le configurazioni di rete che supportano queste applicazioni per assicurarti che siano coerenti con lo stato previsto della rete. Eseguendo questo controllo, puoi assicurarti che i clienti ricevano la latenza più bassa possibile per le tue applicazioni.
Il seguente caso d'uso mostra in che modo Network Topology può aiutarti a controllare le configurazioni esistenti. Ad esempio, puoi verificare che tutte le richieste del client vengano gestite da istanze dell'applicazione della Google Cloud regione più vicina al client. Puoi anche assicurarti che il traffico tra regioni sia ridotto perché proviene da database che replicano i dati a livello globale.
Panoramica della topologia
Il deployment si estende su tre Google Cloud regioni (us-central1,
europe-west1 e asia-east1). Tutte le richieste dei client esterni vengono gestite da un singolo bilanciatore del carico delle applicazioni esterno con più backend in ciascuna delle tre regioni. Le richieste dei client provenienti da una delle tre regioni di attività (America, EMEA e APAC) vengono gestite dalle istanze dell'applicazione nella regioneGoogle Cloud più vicina.
Il seguente grafico mostra la gerarchia di primo livello per il deployment.
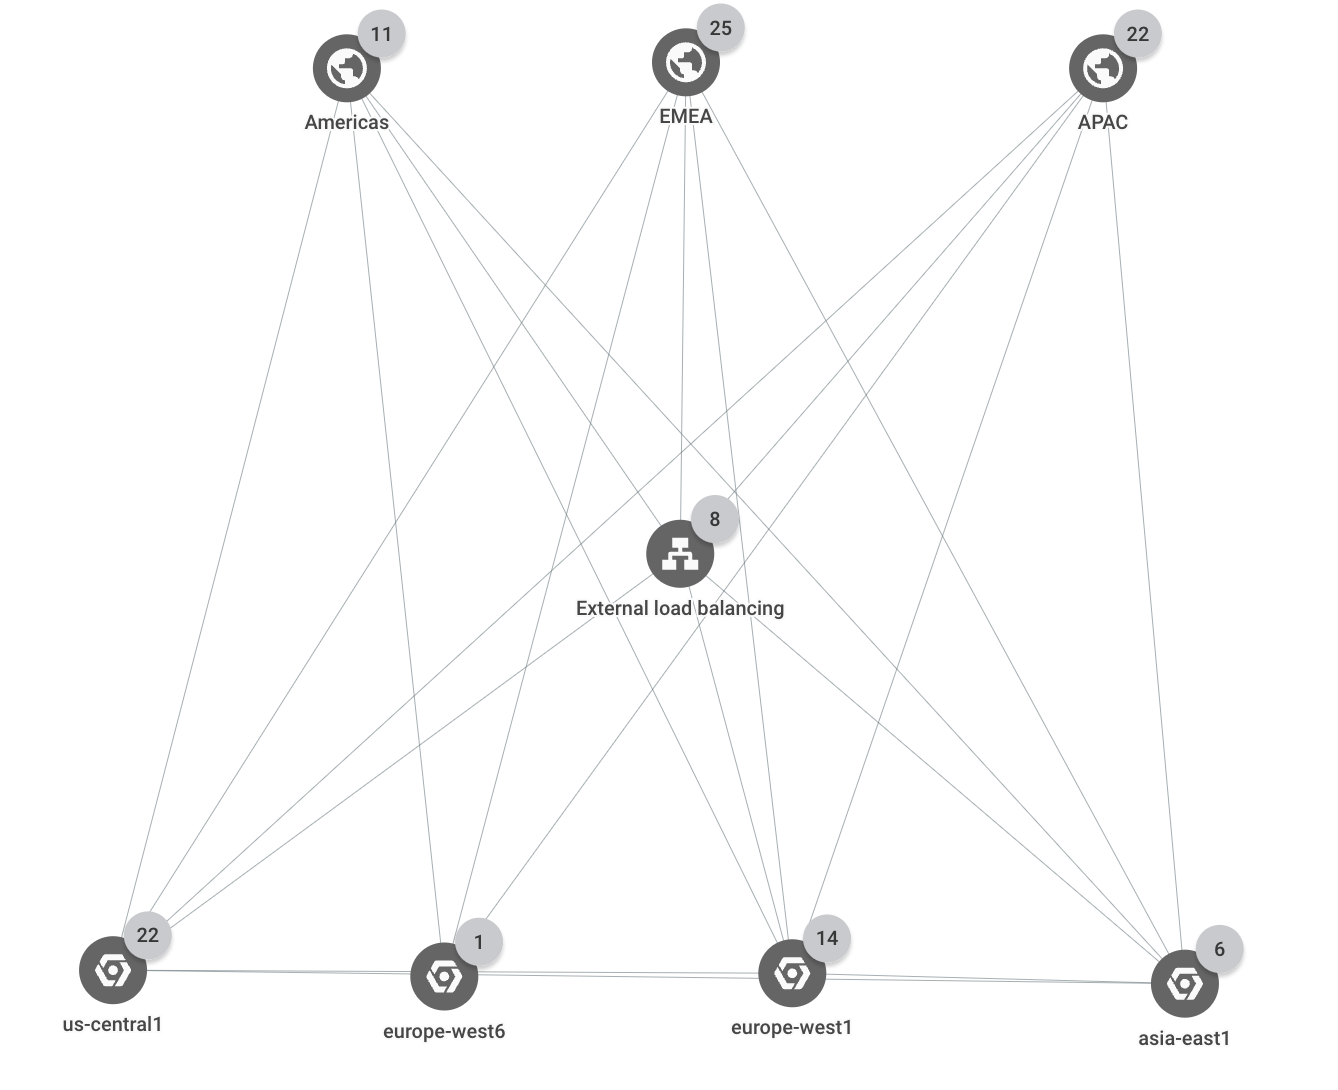
Risorse e percorsi di traffico
In questo esempio, il progetto contiene le seguenti Google Cloud risorse:
1 bilanciatore del carico HTTPS
4 servizi di backend:
browse,shopping_cart,checkoutefeeds12 gruppi di istanze (che sono i backend del bilanciatore del carico)
Esiste un gruppo di istanze per ogni servizio di backend in ciascuna delle tre regioni.
3 istanze di database, una in ogni regione
Prevedi che il traffico proveniente da determinati paesi venga indirizzato alle seguenti località:
- Il traffico proveniente dai paesi della regione aziendale
Americasviene indirizzato ai backend della regioneus-central1. Ad esempio, il traffico di un client esterno in Canada passa attraverso il bilanciatore del carico fino al backendcheckoutnella regioneus-central1. - Il traffico proveniente dai paesi della regione dell'attività
EMEAviene indirizzato ai backend della regioneeurope-west1. Ad esempio, il traffico da un client esterno in Polonia passa attraverso il bilanciatore del carico fino al backendcheckoutnella regioneeurope-west1. - Il traffico proveniente dai paesi della regione dell'attività
APACviene indirizzato ai backend della regioneasia-east1. Ad esempio, il traffico di un client esterno in Giappone passa attraverso il bilanciatore del carico fino al backendcheckoutnella regioneasia-east1. - Il traffico verso un'istanza di database proviene da un backend nella stessa regione. ad esempio, i backend in
asia-east1inviano dati solo all'istanza di database inasia-east1. - Il traffico tra regioni è limitato alla replica del database. Ad esempio, il traffico tra
us-central1eeurope-west1avviene solo tra le istanze di database in queste regioni.
Flusso di traffico imprevisto
In questo scenario, scopri che il traffico proveniente dalla regione dell'attività EMEA ora arriva a due regioni Google Cloud diverse, us-central1 e
europe-west1. Utilizzando Network Topology, scopri che uno dei backend è sovrautilizzato.
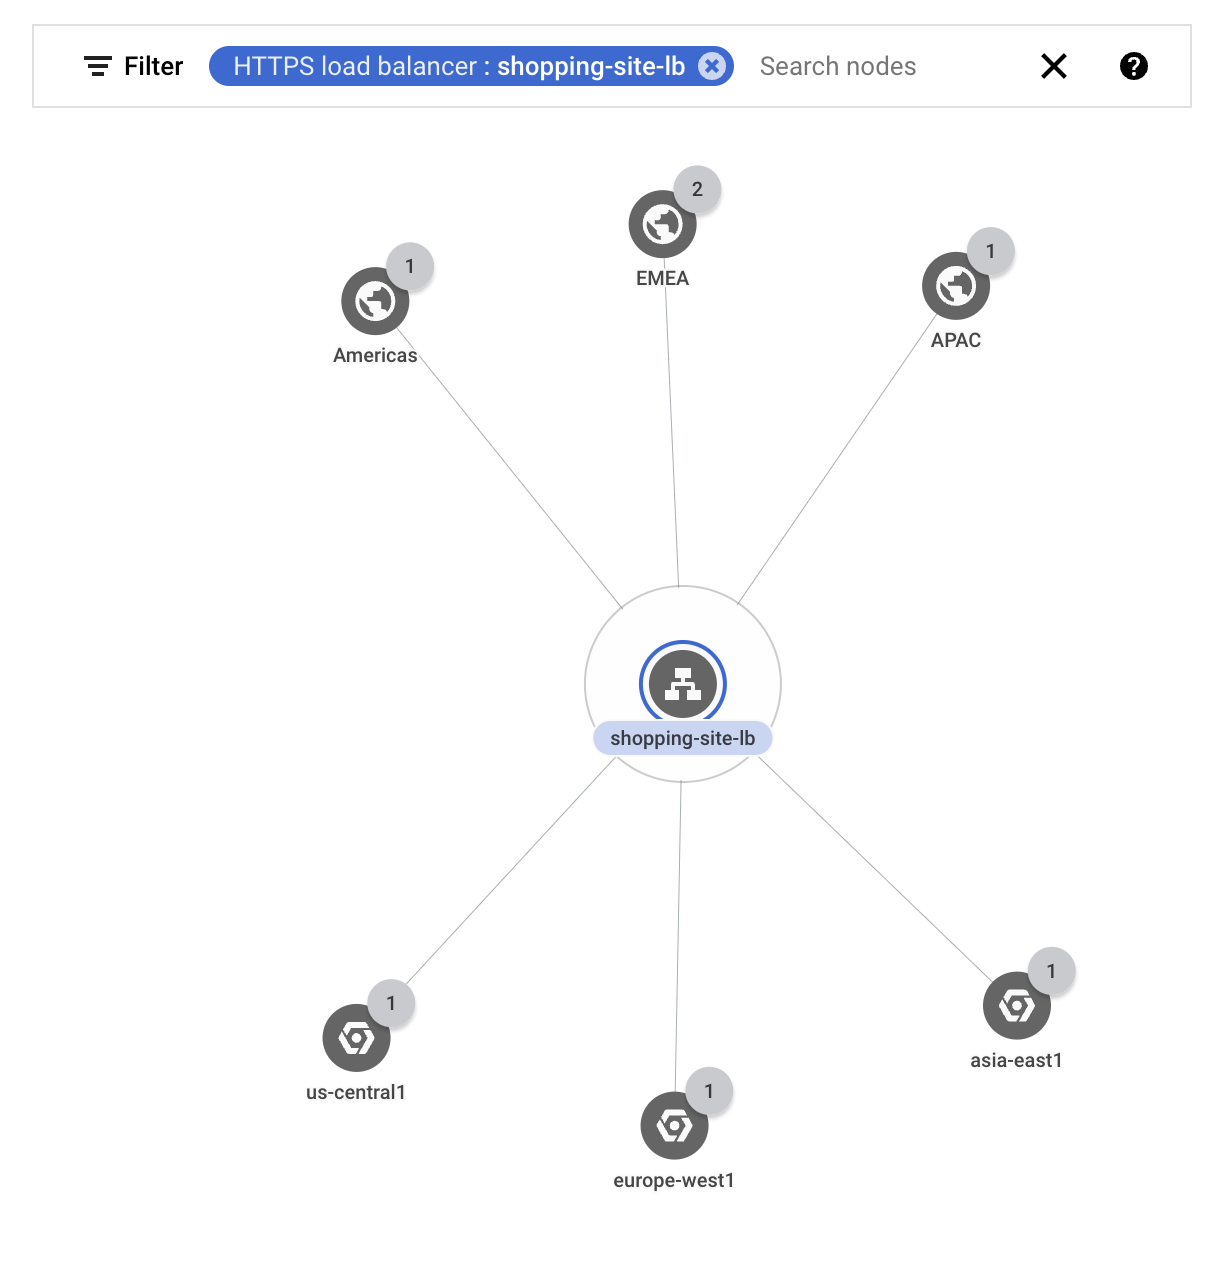
Vuoi verificare che il traffico esterno che passa per il bilanciatore del carico alla fine venga indirizzato alla regione corretta. Google Cloud Filtra il grafico in modo da mostrare solo il traffico per il bilanciatore del carico esterno
shopping-site-lb.Dopo aver applicato il filtro, Network Topology mostra solo le connessioni relative al bilanciatore del carico, come mostrato nell'esempio seguente.
Tieni premuto il cursore sopra ogni regione aziendale per evidenziare la comunicazione rivolta a quella regione.
Quando tieni premuto il cursore sopra Americas e APAC, viene visualizzato il traffico diretto alla regione Google Cloud più vicina:
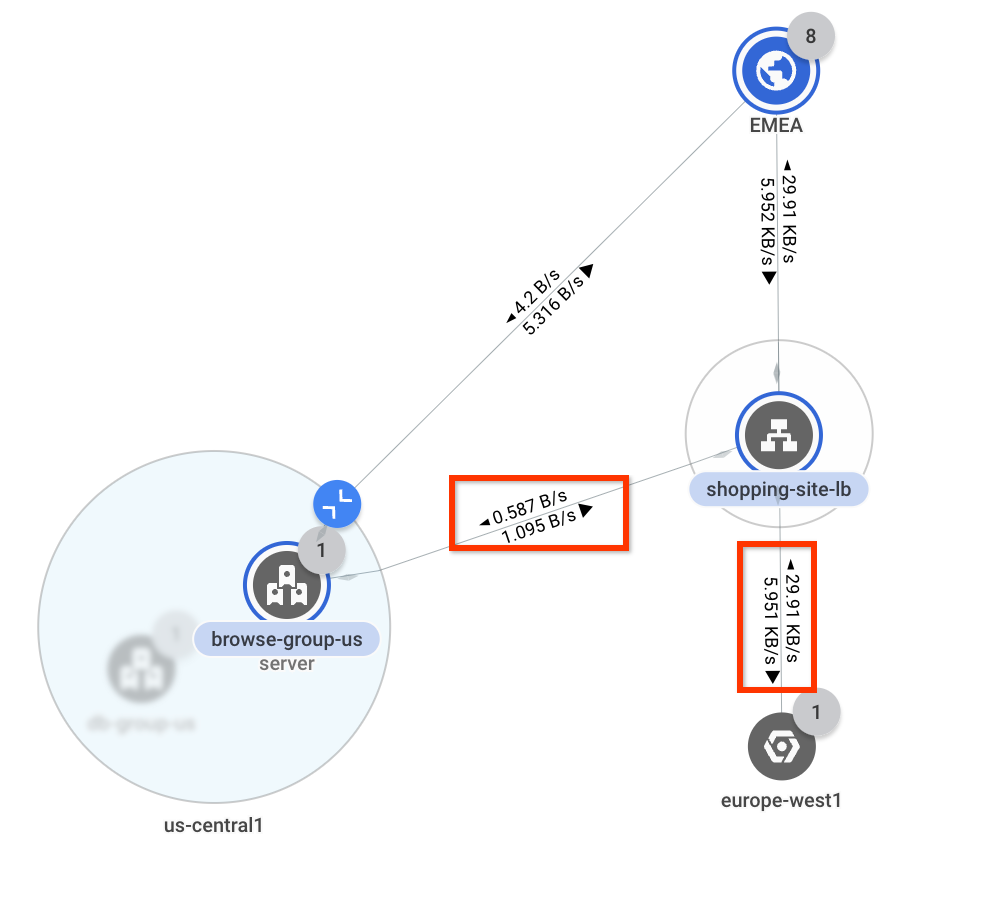
us-central1easia- east1rispettivamente. Tuttavia, quando tieni premuto il cursore sopra EMEA, visualizzate il traffico versous-central1eeurope-west1. Idealmente, per ridurre la latenza, tutto il traffico proveniente dall'EMEA dovrebbe essere indirizzato aeurope-west1.Poi fai clic su EMEA per studiare il throughput tra questa regione e le altre regioniGoogle Cloud . Network Topology sovrappone i valori della larghezza di banda su ogni connessione. Vedrai che circa 0,58 byte al secondo vengono indirizzati a
us-central1e 29,9 kilobyte al secondo aeurope-west1. Sai che la maggior parte del traffico viene indirizzata come previsto, ma parte del traffico viene indirizzata aus-central1.1La figura è fornita come riferimento. I dati non riflettono il caso d'uso.
Per approfondire, espandi
us-central1per visualizzare la destinazione del traffico. Poiché in quella regione esiste una sola rete con una singola sottorete, Network Topology non mostra questi livelli della gerarchia e passa ai gruppi di istanze.Vedrai che il traffico viene indirizzato a un gruppo di istanze associato al servizio di backend del bilanciatore del carico. Poiché si tratta di una quantità relativamente ridotta di traffico diretto a
europe-west1, è possibile che le risorse ineurope-west1siano sovrautilizzate e causino il sovraccarico del traffico inus-central1.1La figura è fornita come riferimento. I dati non riflettono il caso d'uso.
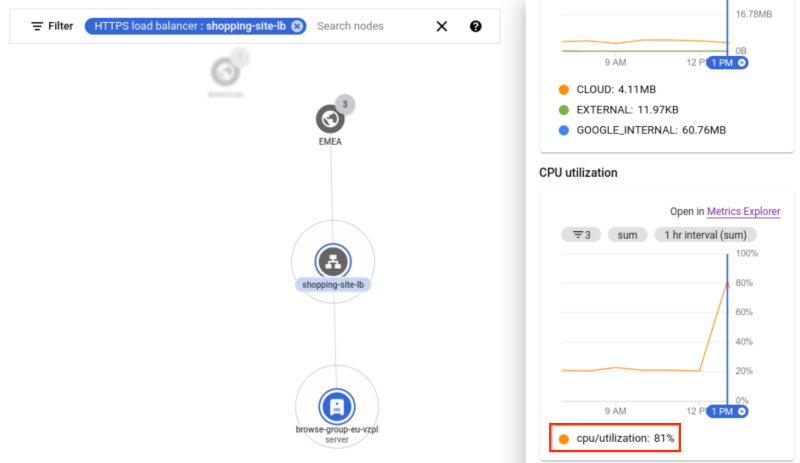
Per confermare la tua conclusione, espandi la regione
europe-west1fino a raggiungere l'istanza associata al servizio di backend dello stesso bilanciatore del carico. Network Topology mostra i grafici delle serie temporali nel riquadro dettagli dell'istanza.Nel grafico, noti che il tasso di utilizzo della CPU è pari all'81% per l'istanza. La soglia per questo esempio è dell'80%, il che indica che l'istanza è sovraabbonata. Per risolvere il problema, esegui l'aumento di scala del gruppo di istanze in modo che il traffico torni al flusso ideale.
1La figura è fornita come riferimento. I dati non riflettono il caso d'uso.
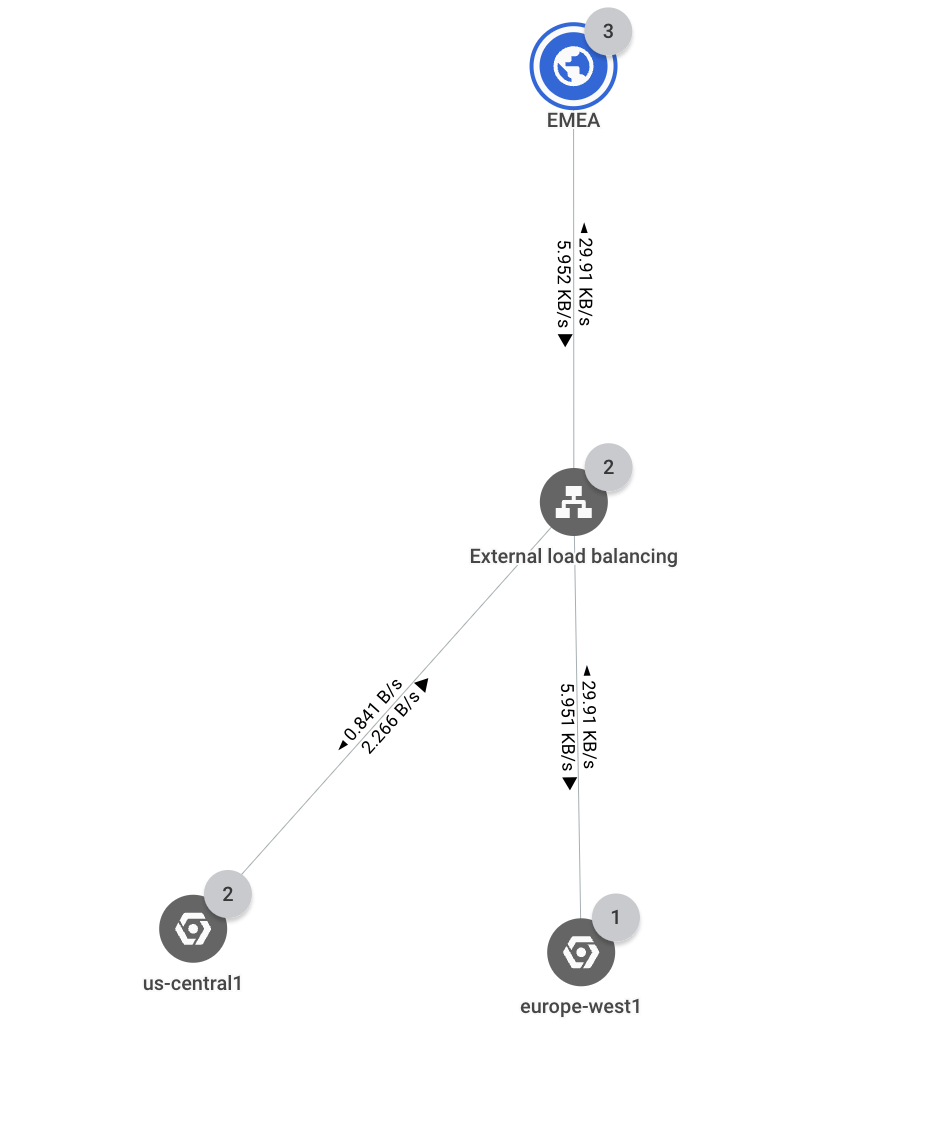
Traffico tra regioni
Nella sezione seguente, verifichi che il traffico interno tra regioni sia limitato solo al traffico delle istanze di database.
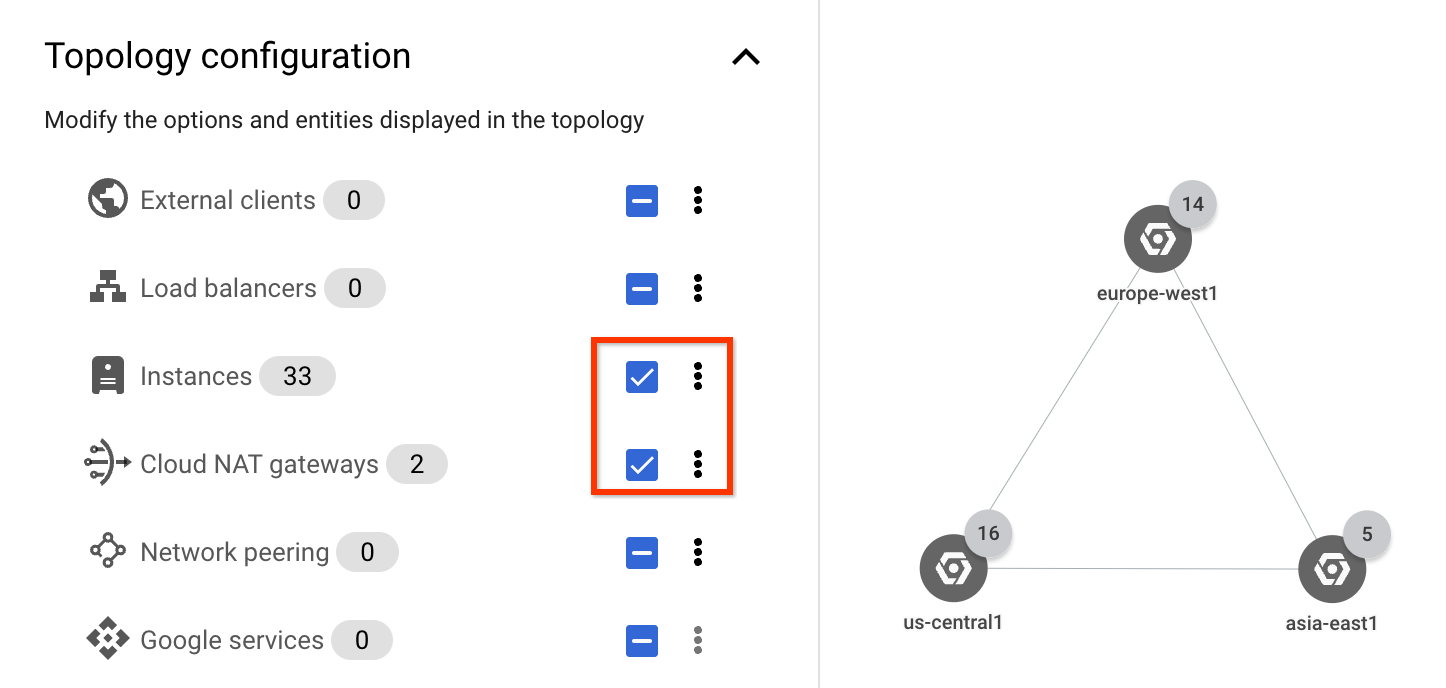
Per concentrarti sul traffico interno, nell'elenco Configurazione della topologia seleziona solo le caselle di controllo Istanze e Gateway NAT cloud. Poiché visualizzi solo il traffico all'interno della tua applicazione, non è necessario visualizzare i client esterni e il traffico del bilanciatore del carico esterno.
Espandi la regione
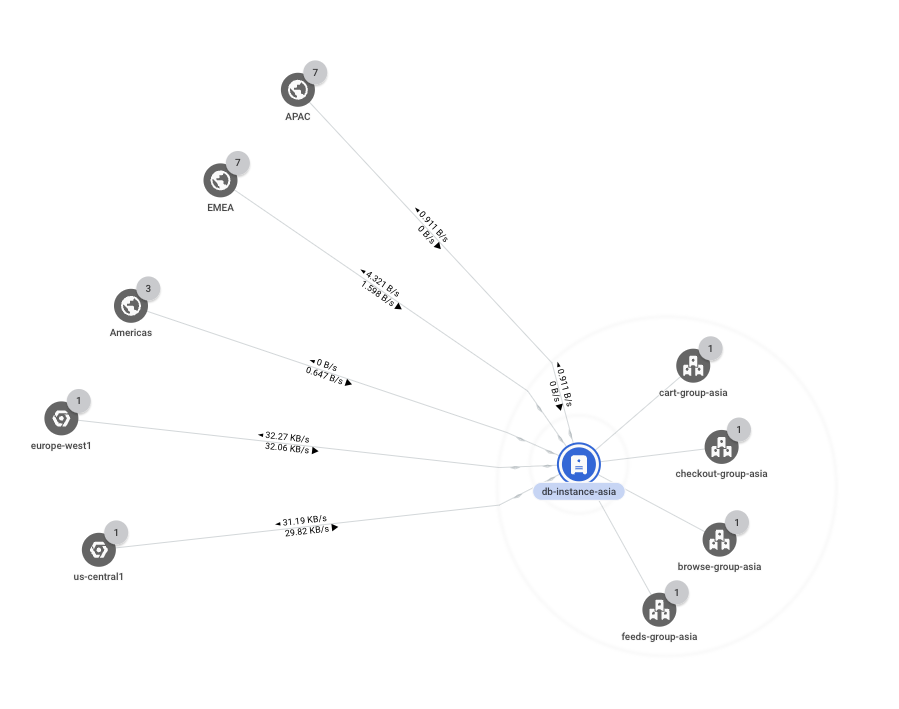
asia-east1e visualizzi cinque gruppi di istanze. Non vengono aggregati per rete, subnet o zona perché si trovano tutti nella stessa rete, subnet e così via.Noti che solo un gruppo di istanze (
db-group-asia) contiene un percorso per il traffico interregionale. Tutti gli altri gruppi di istanze comunicano all'interno della regione.Continua ad espandere il gruppo
db-group-asiafino a raggiungere l'entità di base. In questo scenario, l'entità di base è un'istanza di una macchina virtuale (db-instance-asia) che funge da server di database. Sta comunicando con altre regioni per replicare i dati, come previsto, quindi non sono necessarie ulteriori indagini. ̦1La figura è fornita come riferimento. I dati non riflettono il caso d'uso.
Passaggi successivi
- Monitorare la configurazione di rete con Network Topology
- Caso d'uso: risolvere i problemi di connettività di rete
- Risolvere i problemi relativi a Network Topology