이 문서에서는 로그 대시보드 페이지를 사용하여 사전 정의된 대시보드를 사용하거나 커스텀 대시보드를 만들어 시스템 동작 추세를 감지하고 워크로드를 모니터링하며 문제를 진단하고 해결하는 방법을 설명합니다.
대시보드 유형
로그 대시보드 페이지에는 Google Cloud 프로젝트의 리소스 성능을 시각화하는 두 가지 옵션인 사전 정의된 대시보드와 커스텀 대시보드가 있습니다. 항상 사전 정의된 대시보드를 사용할 수 있으며 Monitoring에서 관리하지만 개발자가 맞춤설정할 수도 있습니다.
사전 정의된 대시보드
사전 정의된 대시보드는 자동으로 구성되며 로그 데이터를 생성하는 Google Cloud 프로젝트의 리소스에 대한 정보만 제공합니다.
사전 정의된 대시보드는 다음 리소스 유형별로 차트 쌍으로 구성됩니다.
Google Kubernetes Engine
Compute Engine
App Engine
Cloud Load Balancing
Cloud SQL
BigQuery
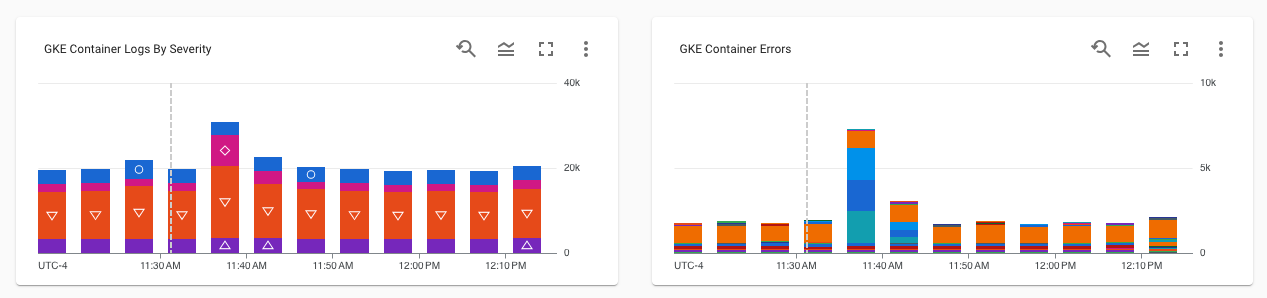
한 차트에는 로그 수와 심각도 유형(예: WARNING)이 표시됩니다. 다른 차트에는 오류가 포함된 로그가 표시됩니다. 심각도 유형이나 오류 로그에 대한 자세한 내용을 보려면 마우스 포인터를 차트 위로 가져갑니다.
다음 스크린샷은 사전 정의된 대시보드의 예시입니다.
커스텀 대시보드
사전 정의된 대시보드의 콘텐츠에 문제 해결에 필요한 정보가 포함되어 있지 않으면 커스텀 대시보드를 만듭니다. 커스텀 대시보드를 사용하면 관심 있는 정보를 유용한 방식으로 구성하여 표시할 수 있습니다.
예를 들어 프로덕션 환경에 가상 머신(VM)에 대한 로그, 측정항목, 알림 정책을 표시하는 대시보드를 만들 수 있습니다.
커스텀 대시보드는 Cloud Monitoring에서 관리되지만 로그 대시보드 페이지에서 사용할 새 커스텀 대시보드를 만들어야 합니다. Cloud Logging에서만 로그 대시보드 페이지에서 만든 커스텀 대시보드에 액세스할 수 있습니다. 커스텀 대시보드를 만들면 사전 정의된 대시보드가 커스텀 대시보드에 복사되므로 불필요한 위젯을 삭제하고 누락된 콘텐츠를 추가할 수 있습니다.
[[["이해하기 쉬움","easyToUnderstand","thumb-up"],["문제가 해결됨","solvedMyProblem","thumb-up"],["기타","otherUp","thumb-up"]],[["이해하기 어려움","hardToUnderstand","thumb-down"],["잘못된 정보 또는 샘플 코드","incorrectInformationOrSampleCode","thumb-down"],["필요한 정보/샘플이 없음","missingTheInformationSamplesINeed","thumb-down"],["번역 문제","translationIssue","thumb-down"],["기타","otherDown","thumb-down"]],["최종 업데이트: 2025-04-23(UTC)"],[],[],null,["# Visualize log severity and error metrics\n\nThis document describes how to use the Logs Dashboard page to detect trends\nin the behavior of your systems, monitor your workloads, and diagnose and\nresolve problems by using the predefined dashboard or by creating a custom\ndashboard.\n\nTypes of dashboards\n-------------------\n\nThe **Logs Dashboard** page has two options for visualizing the performance\nof the resources in your Google Cloud project: the predefined dashboard and\na custom dashboard. The predefined dashboard is always available and is managed\nby Monitoring, but you can also customize this predefined\ndashboard.\n\n### Predefined dashboard\n\nThe predefined dashboard is automatically configured and only provides\ninformation for resources in your Google Cloud project that are producing\nlogs data.\n\nThe predefined dashboard is organized into a pair of charts for each of the\nfollowing resource types:\n\n- Google Kubernetes Engine\n\n- Compute Engine\n\n- App Engine\n\n- Cloud Load Balancing\n\n- Cloud SQL\n\n- BigQuery\n\nOne chart displays the number of logs and their severity types, such as\n`WARNING`. The other chart displays logs that contain errors. To get more\ninformation about severity types or error logs, hold your pointer over the\nchart.\n\nThe following screenshot is an example of the predefined dashboard:\n\n### Custom dashboard\n\nIf the content in the predefined dashboard doesn't contain the information you\nneed to help you troubleshoot, then consider creating a custom\ndashboard. [Custom dashboards](/monitoring/charts/dashboards) let you display\ninformation that is of interest to you, organized in a way that's useful to you.\nFor example, you might create a dashboard that displays the logs, metrics, and\nalerting policies for virtual machines (VM) in your production environment.\n\nCustom dashboards are managed by Cloud Monitoring, but you must create a\nnew custom dashboard to use in the **Logs Dashboard** page. The custom\ndashboard you create in the **Logs Dashboard** page is only accessible in\nCloud Logging. When you create a custom dashboard, the predefined dashboard\nis copied into the custom dashboard, so that you can delete unnecessary widgets\nand add missing content.\n\nView the predefined dashboard\n-----------------------------\n\nTo view the predefined dashboard, do the following:\n\n1. In the Google Cloud console, go to the **Logs Dashboard** page:\n\n [Go to **Logs Dashboard**](https://console.cloud.google.com/monitoring/dashboards/resourceList/logs)\n\n \u003cbr /\u003e\n\n If you use the search bar to find this page, then select the result whose subheading is\n **Monitoring**.\n\n \u003cbr /\u003e\n\n | **Note:** Ensure that a project is selected. When a project isn't selected, the dashboard displays a loading-data spinner.\n\n \u003cbr /\u003e\n\n2. If the **Dashboard** menu is enabled, then select **Predefined**.\n\nCustomize the predefined dashboard\n----------------------------------\n\nYou can't modify the predefined dashboard. However, you can make a copy of\nthis dashboard, and then modify the copy.\n\nTo create a copy of the predefined dashboard, do the following:\n\n1. In the Google Cloud console, go to the **Logs Dashboard** page:\n\n [Go to **Logs Dashboard**](https://console.cloud.google.com/monitoring/dashboards/resourceList/logs)\n\n \u003cbr /\u003e\n\n If you use the search bar to find this page, then select the result whose subheading is\n **Monitoring**.\n\n \u003cbr /\u003e\n\n | **Note:** Ensure that a project is selected. When a project isn't selected, the dashboard displays a loading-data spinner.\n\n \u003cbr /\u003e\n\n2. In the toolbar of the dashboard, select *edit* **Customize Dashboard** .\n\n A dashboard is created and displayed. The name of the dashboard is listed in the\n **Custom view name** text box. The toolbar also displays three buttons: **Add widget** ,\n **Exit Edit Mode** , and **Save**.\n3. Modify the dashboard by adding or removing widgets, by editing existing widgets, or by moving widgets.\n\n For example, to add a widget, click **Add widget** , complete the dialog, and then\n select **Apply**. For more information about adding widgets, see the following pages:\n - [Add charts and tables](/monitoring/charts#add_chart).\n - [Display alert charts and incidents](/monitoring/dashboards/alerts-and-incidents).\n - [Display logs](/monitoring/charts/view-logs).\n - [Add text and groupings](/monitoring/dashboards/text-and-grouping).\n4. After you complete your modifications, go to the toobar and click **Save**.\n\n To toggle between the predefined dashboard and your custom dashboard, use the\n menu in the toolbar.\n\nWhat's next\n-----------\n\n- For information about dashboards and how to select what information to\n display on a dashboard, see [Dashboards overview](/monitoring/dashboards).\n\n- For information about displaying project-scoped logs on your dashboards, see\n [Display logs on a custom dashboard](/monitoring/charts/view-logs)."]]