Mantieni tutto organizzato con le raccolte
Salva e classifica i contenuti in base alle tue preferenze.
Questa guida mostra come visualizzare e filtrare gli errori con la console
Google Cloud . Puoi filtrare, ordinare e visualizzare ulteriori
dettagli sugli errori, nonché limitare gli errori a un intervallo di tempo specifico.
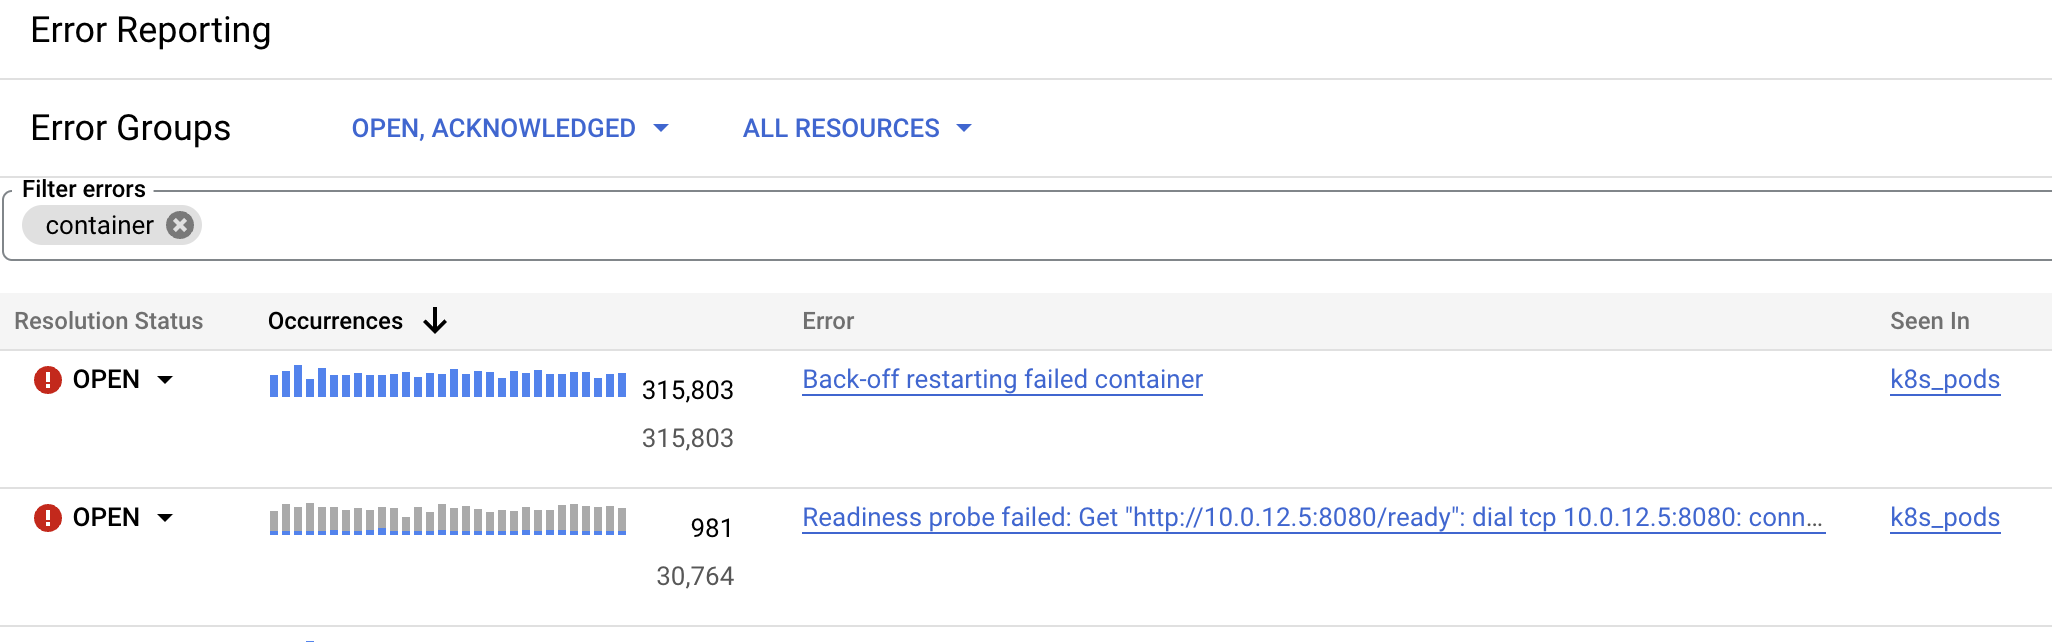
La pagina Report errori mostra un elenco di
gruppi di errori che corrispondono al filtro attuale. Ogni riga mostra
informazioni come lo stato di risoluzione, il codice di risposta e il nome dell'errore per un
gruppo di errori.
La colonna Occorrenze mostra un grafico a barre con barre blu che rappresentano il numero di volte in cui si è verificato un errore nell'intervallo di tempo selezionato. Quando filtri i gruppi di errori per testo, i grafici a barre mostrano barre grigie
per rappresentare il numero di errori che non corrispondevano al filtro di testo:
Per ottenere le autorizzazioni necessarie per visualizzare e filtrare gli errori, chiedi all'amministratore di concederti il ruolo IAM Error Reporting Viewer (roles/errorreporting.viewer) nel progetto.
Per saperne di più sulla concessione dei ruoli, consulta Gestisci l'accesso a progetti, cartelle e organizzazioni.
I dettagli di un gruppo di errori includono la cronologia degli errori, lo stato di risoluzione, il numero di occorrenze e un elenco di errori con timestamp.
Ogni voce dell'elenco contiene un link ai log pertinenti e, se disponibile, una traccia dello stack.
Per visualizzare i dettagli di un gruppo di errori:
Nella console Google Cloud , vai alla pagina Error Reporting:
Puoi trovare questa pagina anche utilizzando la barra di ricerca.
Fai clic sul nome dell'errore.
La pagina Dettagli gruppo di errori mostra informazioni sul gruppo di errori,
inclusi la cronologia di un errore, istanze di errori specifiche e informazioni
diagnostiche dagli esempi di errori. Se Gemini è abilitato nel
progetto, puoi utilizzarlo per
ricevere suggerimenti per la risoluzione dei problemi.
Visualizza le voci di log associate
Per visualizzare la voce di log associata a un errore di esempio, fai clic su Visualizza log da
qualsiasi voce nel riquadro Esempi recenti. In questo modo accedi alla pagina
Esplora log.
In Esplora log, il riquadro dell'editor di query è precompilato con un filtro che contiene il campo ID error_groups. L'elenco delle voci di log
che contribuiscono a quel gruppo di errori viene visualizzato nel riquadro Risultati delle query.
Quando una voce di log fa parte di un gruppo di errori, Logs Explorer aggiunge il
pulsante del gruppo di errori () alla visualizzazione della
voce di log. Fai clic sul pulsante per accedere ai dettagli del raggruppamento o per modificare le voci di log
visualizzate. Per saperne di più, vedi
Trovare voci di log con gruppi di errori.
Per ulteriori informazioni sull'utilizzo della console Google Cloud per visualizzare questi log,
consulta Utilizzo di Esplora log.
Filtrare i gruppi di errori
Puoi utilizzare i filtri sulla barra degli strumenti di Error Reporting per filtrare
in base allo stato, alle risorse interessate e alla regione dei bucket log
che archiviano le voci di log.
Filtrare i gruppi di errori per risorsa
Per filtrare i gruppi di errori in base alla risorsa, seleziona il menu Tutte le risorse e poi
seleziona una risorsa. Alcune risorse consentono di filtrare ulteriormente in base alle etichette dei gruppi di errori.
Il tipo e il numero di etichette dei gruppi di errori disponibili variano a seconda della
risorsa. Ad esempio, se hai gruppi di errori per la risorsa
Servizi di container Kubernetes, puoi filtrare prima per servizio e poi per versione:
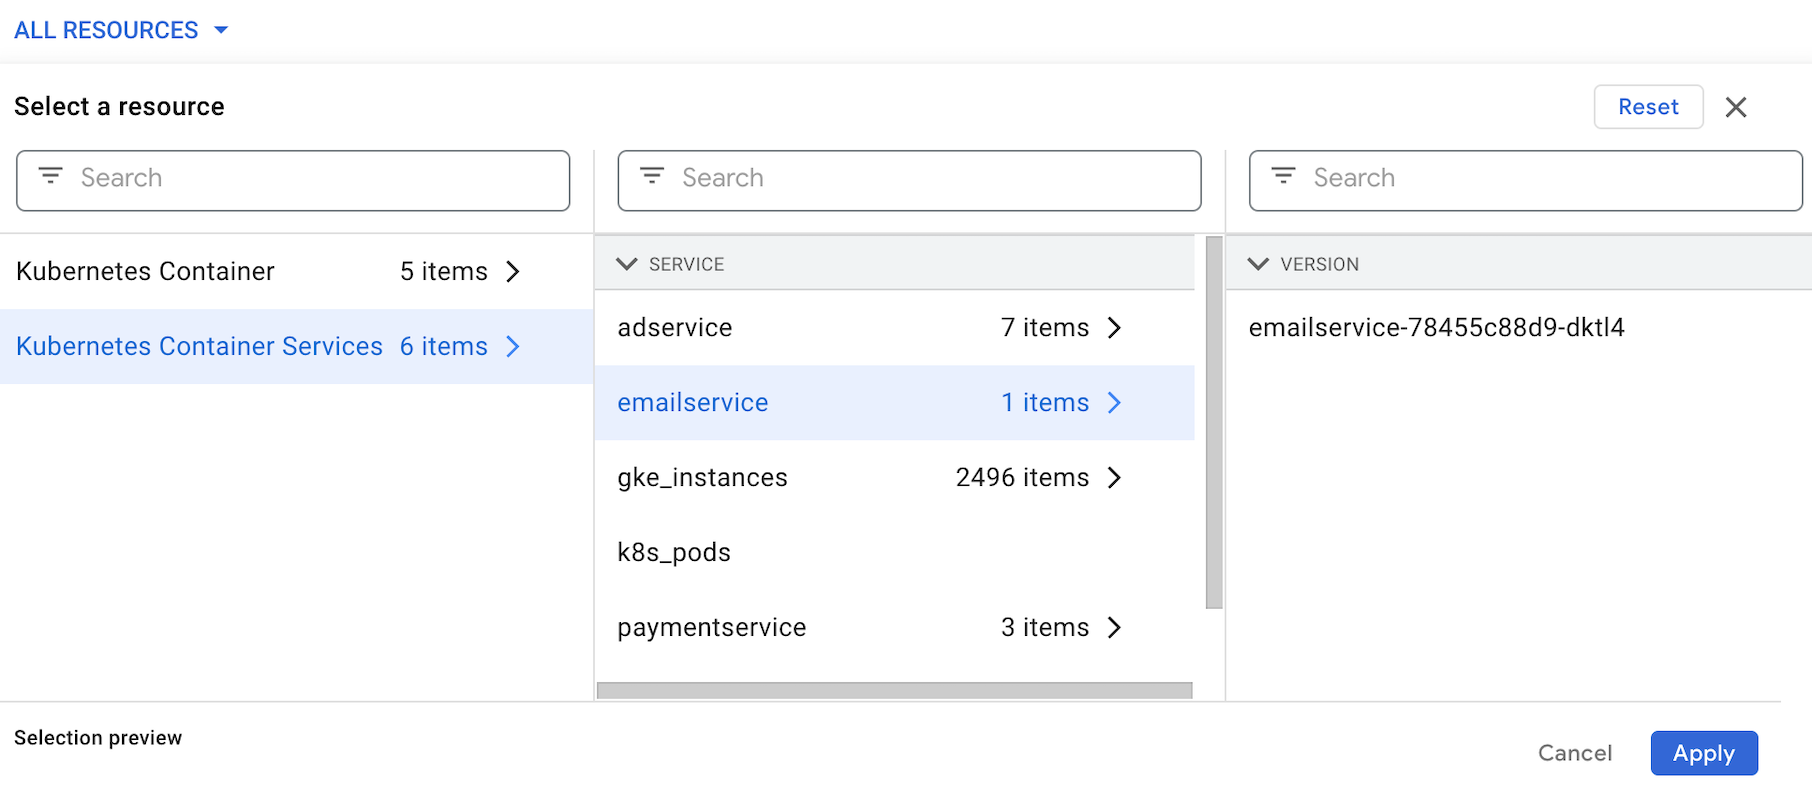
Per salvare le selezioni, fai clic su Applica.
Per cancellare i filtri delle risorse e reimpostare l'elenco dei
gruppi di errori filtrati, seleziona Reimposta e poi Applica.
Filtrare i gruppi di errori per testo
Per filtrare gli errori in base al testo, inserisci un valore nel campo di testo Filtra errori.
Il filtro di testo può eseguire una corrispondenza di testo in uno qualsiasi dei seguenti campi:
[[["Facile da capire","easyToUnderstand","thumb-up"],["Il problema è stato risolto","solvedMyProblem","thumb-up"],["Altra","otherUp","thumb-up"]],[["Difficile da capire","hardToUnderstand","thumb-down"],["Informazioni o codice di esempio errati","incorrectInformationOrSampleCode","thumb-down"],["Mancano le informazioni o gli esempi di cui ho bisogno","missingTheInformationSamplesINeed","thumb-down"],["Problema di traduzione","translationIssue","thumb-down"],["Altra","otherDown","thumb-down"]],["Ultimo aggiornamento 2025-09-03 UTC."],[[["\u003cp\u003eThis guide explains how to use the Google Cloud console's Error Reporting page to view and filter error groups, including sorting and viewing detailed error information.\u003c/p\u003e\n"],["\u003cp\u003eThe Error Reporting page displays error groups with details like resolution status, response code, error name, and a bar graph showing error occurrences within a selected time range.\u003c/p\u003e\n"],["\u003cp\u003eTo view detailed information about an error group, click on the error name to access the Error Group Details page, which includes error history, instances, and diagnostic data, with Gemini offering troubleshooting suggestions.\u003c/p\u003e\n"],["\u003cp\u003eYou can filter error groups by status, resources, region, or text-based criteria, including error information, HTTP response code, exception stack, request URL, report location, and HTTP method.\u003c/p\u003e\n"],["\u003cp\u003eThe Log Explorer allows you to view the log entries related to a specific error, with a pre-populated filter containing the \u003ccode\u003eerror_groups\u003c/code\u003e ID, but this field is only usable in Logs Explorer and Log Analytics, not in sinks, alerts, or metrics.\u003c/p\u003e\n"]]],[],null,["This guide shows you how to view and filter errors with the\nGoogle Cloud console. You can filter, sort, and view additional\ndetails about errors, as well as restrict errors to a specific time range.\n\nThe **Error Reporting** page displays a list of\nerror groups that match the current filter. Each row shows\ninformation such as the resolution status, response code, and error name for an\nerror group.\nThe **Occurrences** column shows a bar graph with blue bars that represent the\nnumber of times an error occurred within the selected\ntime range. When you filter error groups by text, the bar graphs show grey bars\nto represent the number of errors that didn't match the text filter:\n\nFor information on how Error Reporting organizes\nerrors into error groups, see\n[How errors are grouped](/error-reporting/docs/grouping-errors).\n\n\u003cbr /\u003e\n\n| **Note** : If you see the message \"Set up Error Reporting\" on the **Error Reporting** page, then your Google Cloud project has no error groups to display.\n\n\u003cbr /\u003e\n\nBefore you begin\n\n- Ensure that you have least one error group. For more information, see [Collect error data by using Error Reporting](/error-reporting/docs/setup).\n\n\u003c!-- --\u003e\n\n-\n\n To get the permissions that\n you need to view and filter errors,\n\n ask your administrator to grant you the\n\n\n [Error Reporting Viewer](/iam/docs/roles-permissions/errorreporting#errorreporting.viewer) (`roles/errorreporting.viewer`)\n IAM role on your project.\n\n\n For more information about granting roles, see [Manage access to projects, folders, and organizations](/iam/docs/granting-changing-revoking-access).\n\n\n You might also be able to get\n the required permissions through [custom\n roles](/iam/docs/creating-custom-roles) or other [predefined\n roles](/iam/docs/roles-overview#predefined).\n\nView error details\n\nThe details of an error group include the history of errors, the\nresolution status, the number of occurrences, and a timestamped list of errors.\nEach entry in the list contains a link to relevant logs and, when available,\na stacktrace.\n\nTo view the details of an error group, do the following:\n\n1. In the Google Cloud console, go to the **Error Reporting** page:\n\n [Go to **Error Reporting**](https://console.cloud.google.com/errors)\n\n \u003cbr /\u003e\n\n You can also find this page by using the search bar.\n2. Click the error name.\n\n The **Error Group Details** page displays information about the error group,\n including the history of an error, specific error instances, and diagnostic\n information from error samples. If Gemini is enabled in the\n project, then you can use Gemini to\n [get troubleshooting suggestions](/error-reporting/docs/troubleshoot-errors-gemini).\n\nView associated log entries\n\nTo view the log entry associated with a sample error, click **View Logs** from\nany entry in the **Recent samples** panel. This takes you to the\n**Logs Explorer** page.\n\nIn the **Logs Explorer** , the query-editor pane is pre-populated with a\nfilter that contains the `error_groups` ID field. The list of log entries\ncontributing to that error group is shown in the **Query results** pane.\n| **Note:** You can filter by the `error_groups` ID field only when querying logs, for example, when you are using the **Logs Explorer** and **Log Analytics** pages. You can't use this field in log sinks, log-based alerts, or log-based metrics.\n\nWhen a log entry is part of an error group, Logs Explorer adds the\nerror group button () to the display of the\nlog entry. Click the button to access grouping details or to change which log\nentries are shown. For more information, see\n[Find log entries with error groups](/logging/docs/analyze/find-logs-error-groups).\n\nFor more information on using the Google Cloud console to view these logs,\nsee [Using the Logs Explorer](/logging/docs/view/logs-explorer-interface).\n\nFilter error groups\n\nYou can use the filters on the Error Reporting toolbar to filter\nby the status, the affected resources, and the region of the log buckets\nthat store your log entries.\n\nFilter error groups by resource\n\nTo filter error groups by resource, select the **All Resources** menu and then\nselect a resource. Some resources let you further filter by error group labels.\nThe type and number of available error group labels vary depending on the\nresource. For example, if you have error groups for the\n**Kubernetes Container Services** resource, then you can filter first by\nservice and then by version:\n\nTo save your selections, click **Apply**.\n\nTo clear your resource filters and reset the list of\nfiltered error groups, select **Reset** and then select **Apply**.\n\nFilter error groups by text\n\nTo filter errors by text, enter a value in the **Filter errors** text field.\nThe text filter can perform a text match on any of the following fields:\n\n- Error information\n- HTTP Response Code\n- Exception stack\n- Request URL\n- Report location\n- HTTP method\n\nWhat's next\n\n- [Learn more about managing errors](/error-reporting/docs/managing-errors)\n- [Learn more about managing service errors](/error-reporting/docs/service-errors)"]]