This guide shows you how to view and filter errors with the Google Cloud console. You can filter, sort, and view additional details about errors, as well as restrict errors to a specific time range.
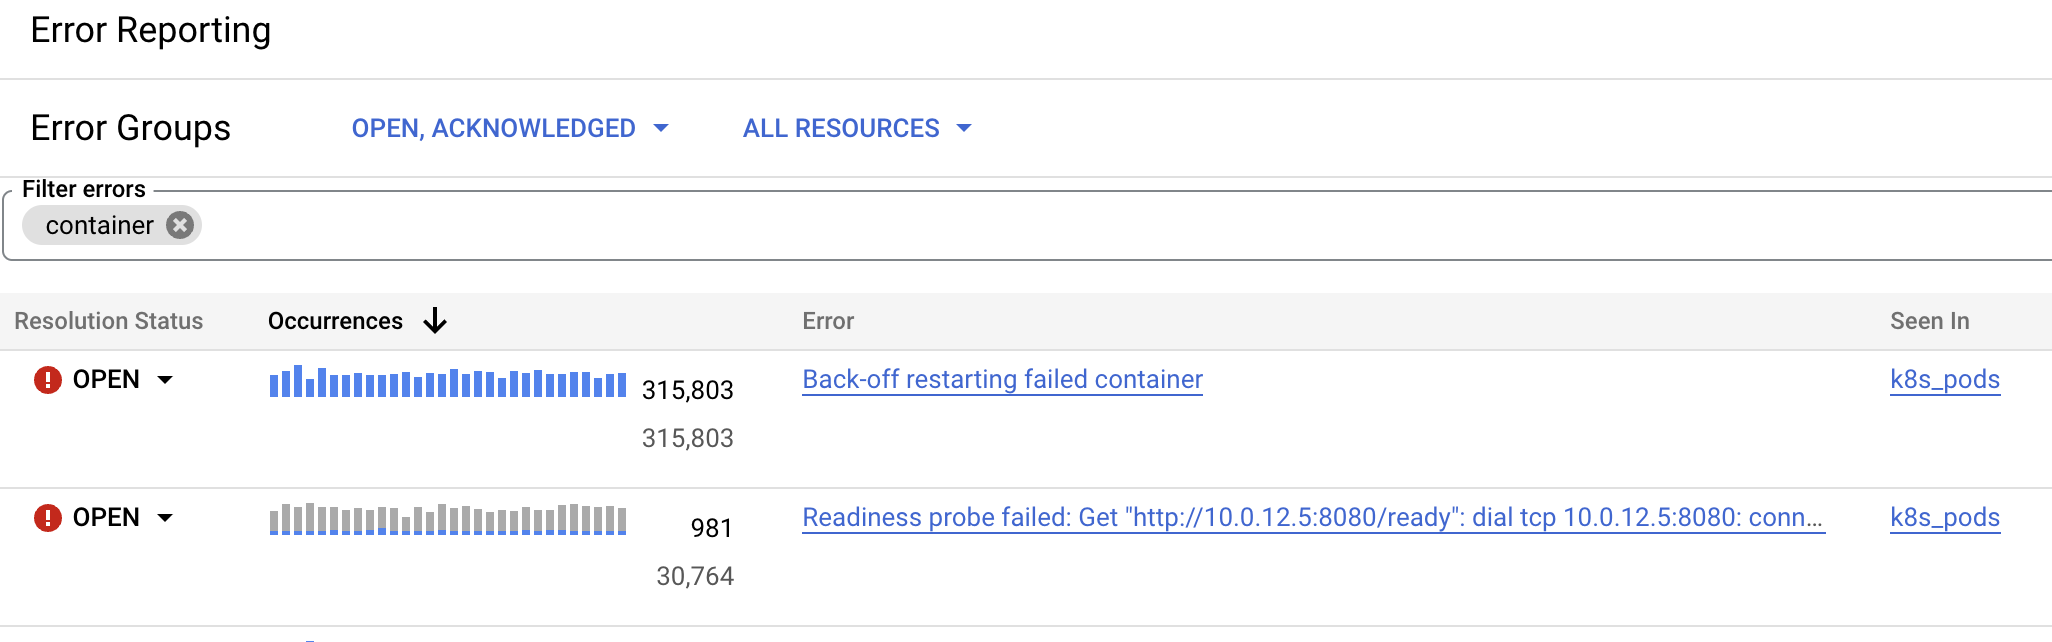
The Error Reporting page displays a list of error groups that match the current filter. Each row shows information such as the resolution status, response code, and error name for an error group. The Occurrences column shows a bar graph with blue bars that represent the number of times an error occurred within the selected time range. When you filter error groups by text, the bar graphs show grey bars to represent the number of errors that didn't match the text filter:
For information on how Error Reporting organizes errors into error groups, see How errors are grouped.
Before you begin
- Ensure that you have least one error group. For more information, see Collect error data by using Error Reporting.
-
To get the permissions that you need to view and filter errors, ask your administrator to grant you the Error Reporting Viewer (
roles/errorreporting.viewer) IAM role on your project. For more information about granting roles, see Manage access to projects, folders, and organizations.You might also be able to get the required permissions through custom roles or other predefined roles.
View error details
The details of an error group include the history of errors, the resolution status, the number of occurrences, and a timestamped list of errors. Each entry in the list contains a link to relevant logs and, when available, a stacktrace.
To view the details of an error group, do the following:
-
In the Google Cloud console, go to the Error Reporting page:
You can also find this page by using the search bar.
Click the error name.
The Error Group Details page displays information about the error group, including the history of an error, specific error instances, and diagnostic information from error samples. If Gemini is enabled in the project, then you can use Gemini to get troubleshooting suggestions.
View associated log entries
To view the log entry associated with a sample error, click View Logs from any entry in the Recent samples panel. This takes you to the Logs Explorer page.
In the Logs Explorer, the query-editor pane is pre-populated with a
filter that contains the error_groups ID field. The list of log entries
contributing to that error group is shown in the Query results pane.
When a log entry is part of an error group, Logs Explorer adds the
error group button ( ) to the display of the
log entry. Click the button to access grouping details or to change which log
entries are shown. For more information, see
Find log entries with error groups.
) to the display of the
log entry. Click the button to access grouping details or to change which log
entries are shown. For more information, see
Find log entries with error groups.
For more information on using the Google Cloud console to view these logs, see Using the Logs Explorer.
Filter error groups
You can use the filters on the Error Reporting toolbar to filter by the status, the affected resources, and the region of the log buckets that store your log entries.
Filter error groups by resource
To filter error groups by resource, select the All Resources menu and then select a resource. Some resources let you further filter by error group labels. The type and number of available error group labels vary depending on the resource. For example, if you have error groups for the Kubernetes Container Services resource, then you can filter first by service and then by version:
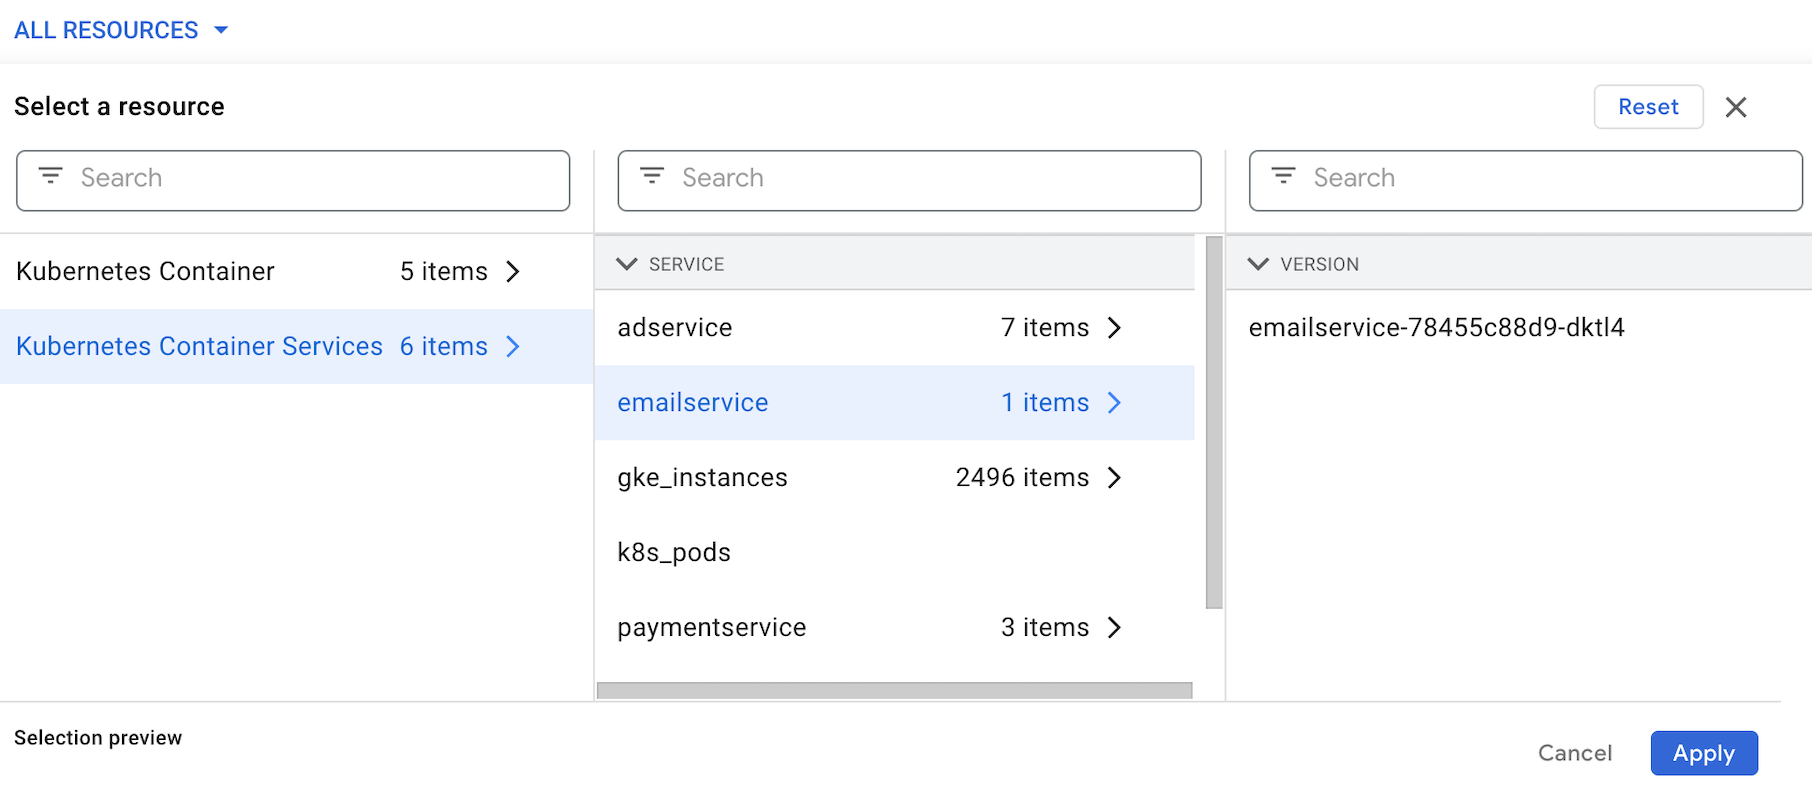
To save your selections, click Apply.
To clear your resource filters and reset the list of filtered error groups, select Reset and then select Apply.
Filter error groups by text
To filter errors by text, enter a value in the Filter errors text field. The text filter can perform a text match on any of the following fields:
- Error information
- HTTP Response Code
- Exception stack
- Request URL
- Report location
- HTTP method