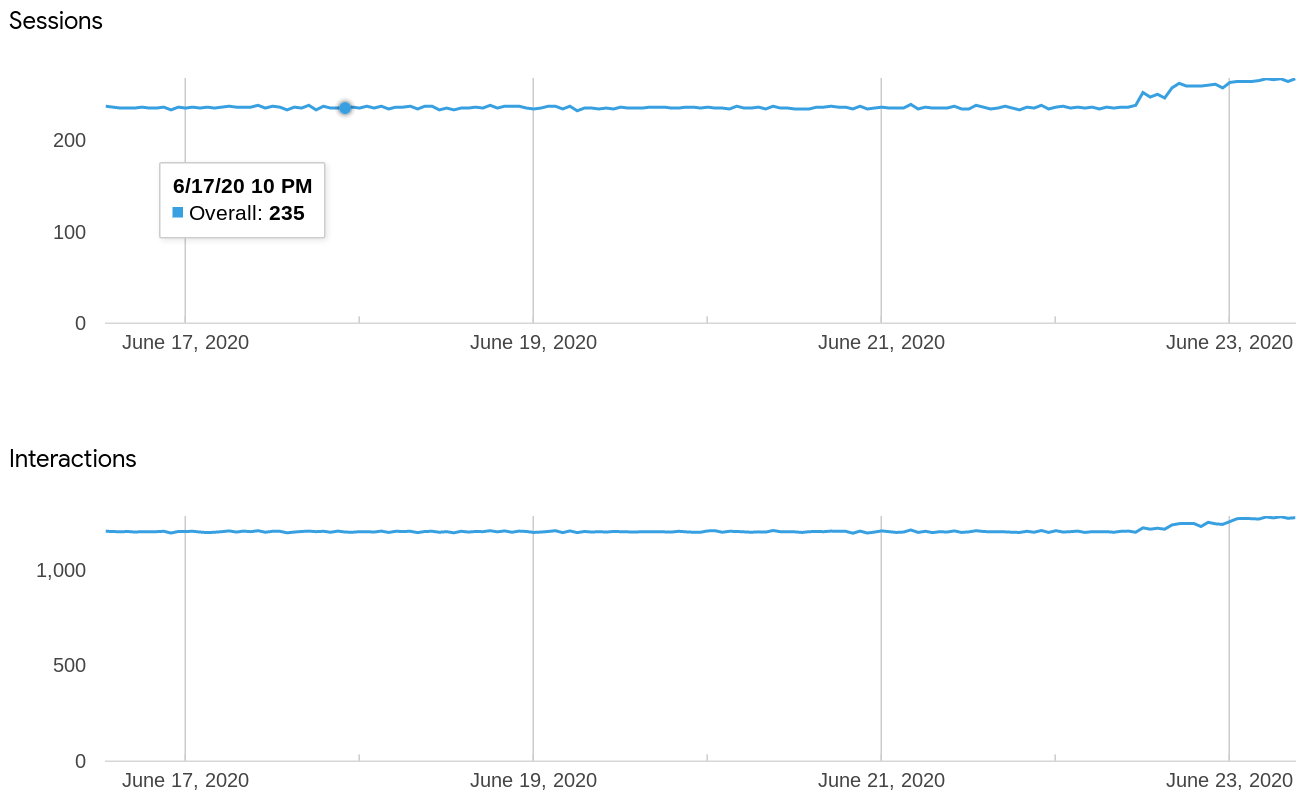
互動:對於大多數檢視畫面,互動包括透過直接 API 呼叫和整合 (Google 助理除外) 間接呼叫的偵測意圖要求次數。
工作階段:工作階段是由提供給互動的會話 ID 決定。您必須建立專屬的工作階段 ID,才能讓這個指標有意義。針對 x 軸上的每個小時,工作階段指標會顯示該小時的活躍工作階段計數。如果工作階段跨越一小時的界線,系統會為每個工作階段計時。因此,圖表上顯示的每小時工作階段總和,可能會大於整個時間範圍內的實際工作階段總數。
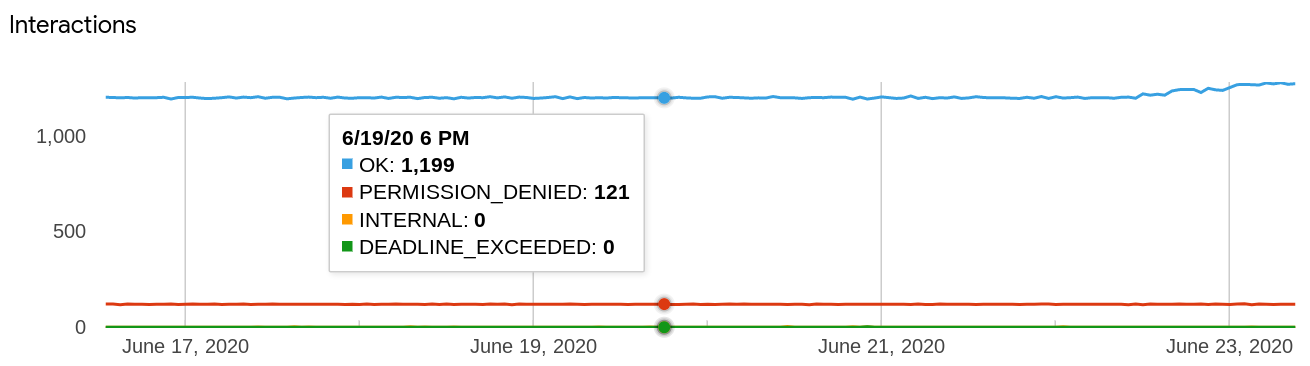
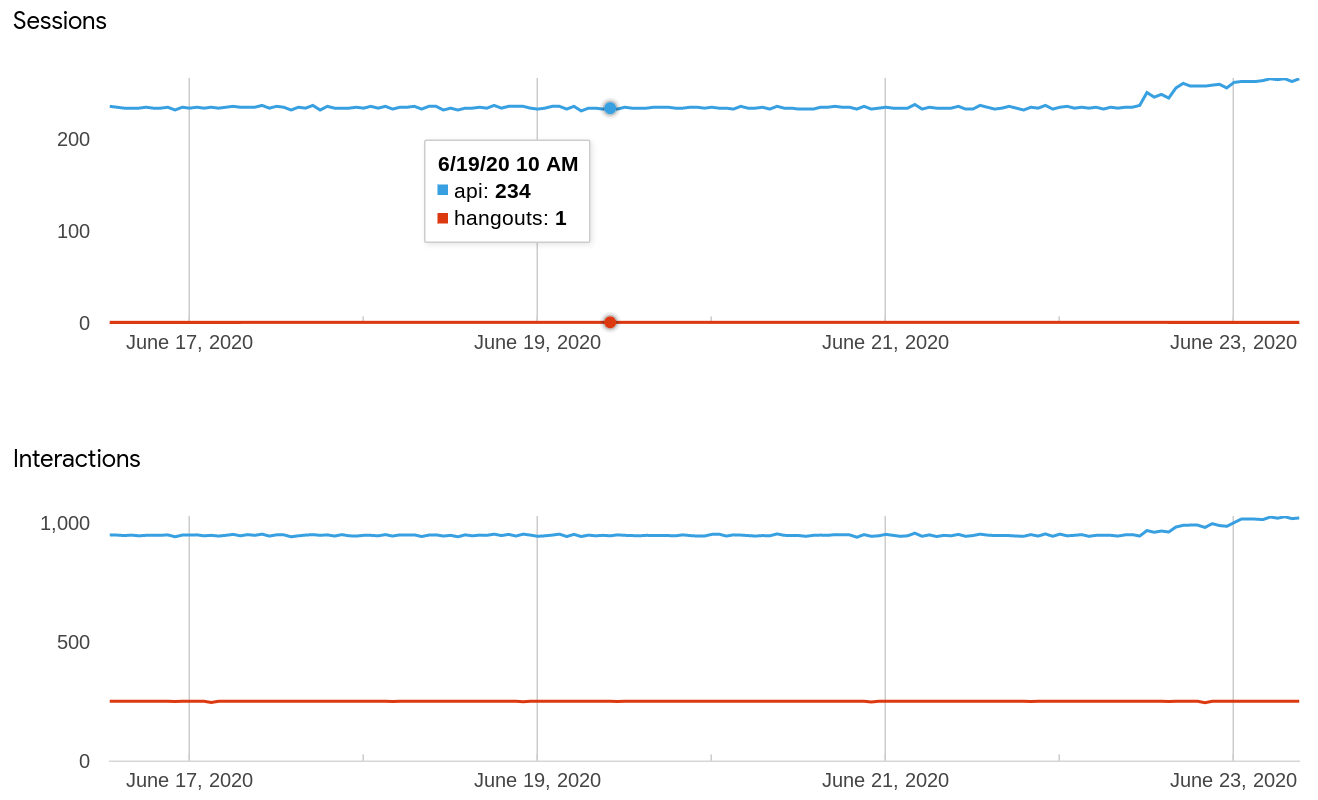
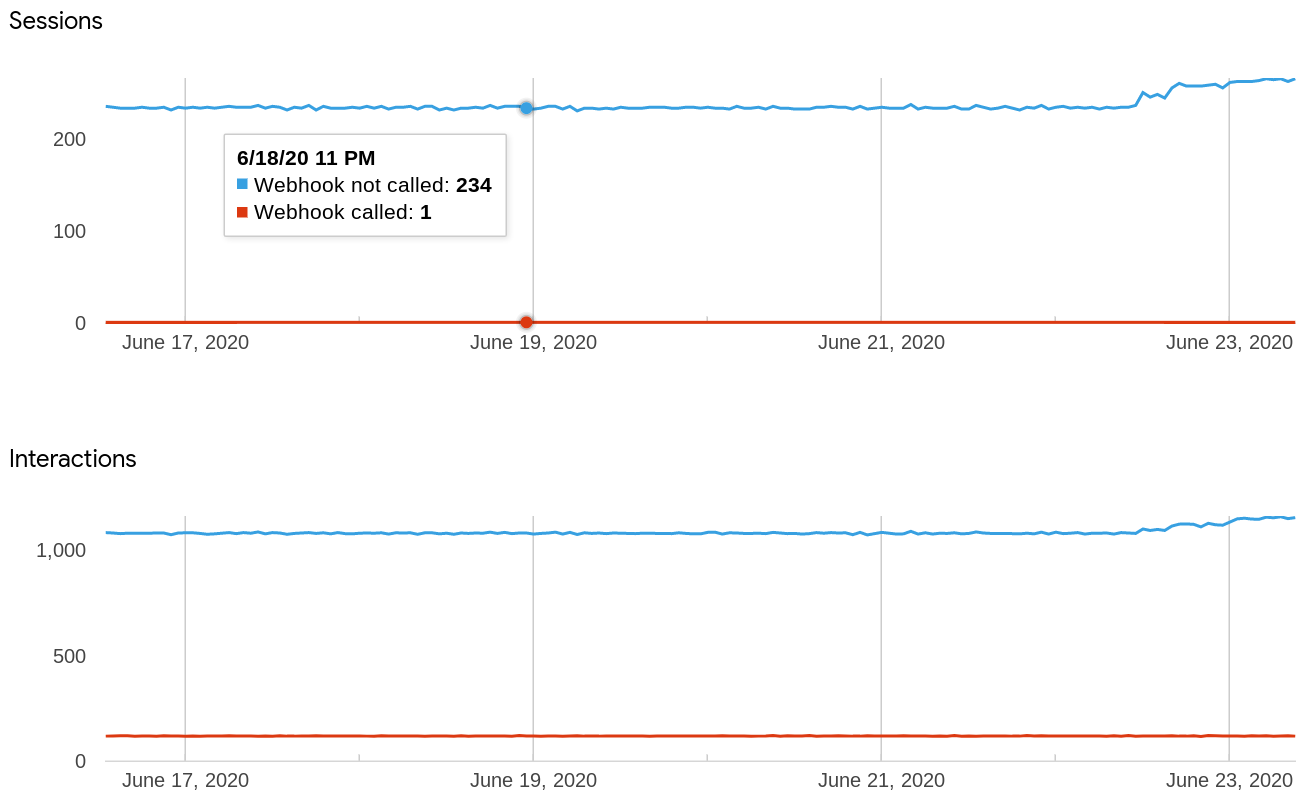
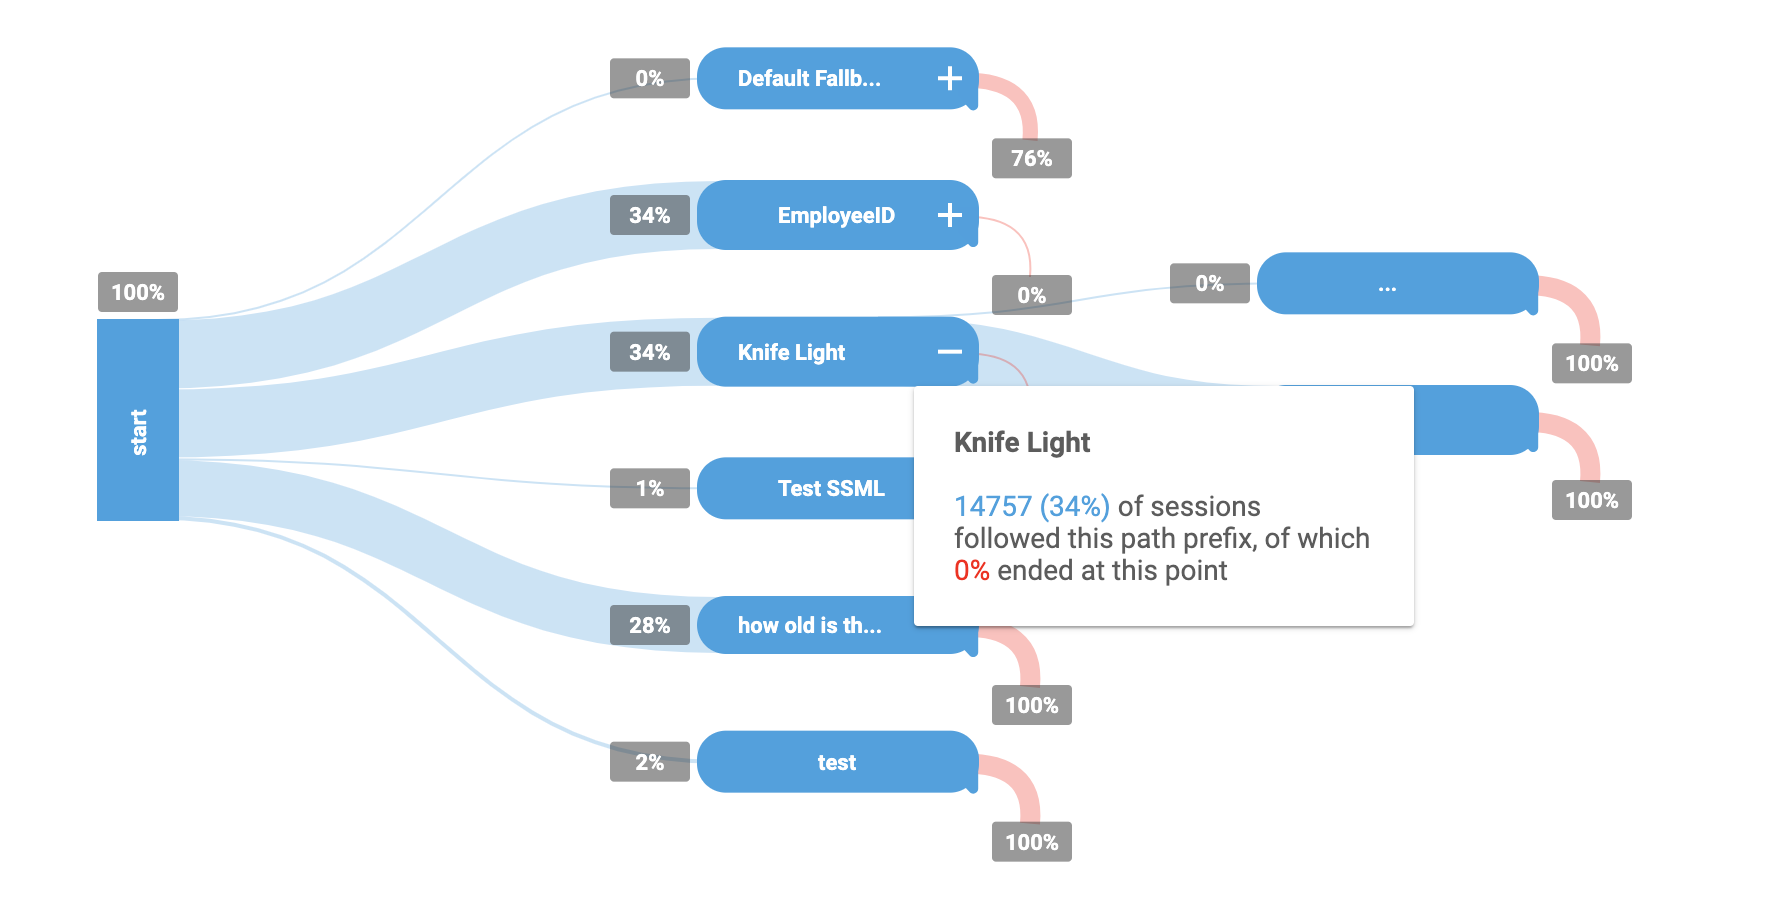
[[["容易理解","easyToUnderstand","thumb-up"],["確實解決了我的問題","solvedMyProblem","thumb-up"],["其他","otherUp","thumb-up"]],[["難以理解","hardToUnderstand","thumb-down"],["資訊或程式碼範例有誤","incorrectInformationOrSampleCode","thumb-down"],["缺少我需要的資訊/範例","missingTheInformationSamplesINeed","thumb-down"],["翻譯問題","translationIssue","thumb-down"],["其他","otherDown","thumb-down"]],["上次更新時間:2025-09-04 (世界標準時間)。"],[[["\u003cp\u003eThe Dialogflow Console's analytics page provides data on agent requests and responses, which can be used to evaluate and improve agent performance.\u003c/p\u003e\n"],["\u003cp\u003eUsers can access various data views, filtered by time range, and all displayed statistics are calculated hourly.\u003c/p\u003e\n"],["\u003cp\u003eCommon metrics displayed include interactions, sessions, and exit percentage, which provide insight into user engagement and session completion.\u003c/p\u003e\n"],["\u003cp\u003eThe analytics page offers multiple views, such as Overall, Status codes, Integrations, and Intent Path, each focusing on different data aspects and metrics.\u003c/p\u003e\n"],["\u003cp\u003eData for the Google Assistant integration is not supported, and there may be a delay of up to one day for data to appear in analytics.\u003c/p\u003e\n"]]],[],null,["# Analytics\n\nThe Dialogflow Console provides an analytics page\nthat shows various agent request and response data statistics.\nThis data helps you assess how your agent is being used in production\nand may be used to improve your agent.\n\nYou can select from multiple data views and filter by time range.\nThe statistics shown on all charts are computed hourly.\nFor most views, only successful request data for the V2 API are included.\n\nOpen the analytics page\n-----------------------\n\nTo open the analytics page:\n\n1. Go to the [Dialogflow ES console](https://dialogflow.cloud.google.com).\n2. Select an agent.\n3. Click **Analytics** in the left sidebar menu.\n4. Choose the **New** tab at the top of the page to select the new user interface described in this guide. You can also go back to the **Legacy** UI if you prefer that.\n\nCommon metrics\n--------------\n\nThe following common metrics are displayed on multiple chart types:\n\n- **Interactions** : For most views, *interactions* include detect intent request counts via direct API calls and indirect calls via integrations (except for Google Assistant).\n- **Sessions** : *Sessions* are determined by the session ID provided to interactions. You must create unique session IDs for this metric to be meaningful. For each hour on the x-axis, the *sessions* metric shows a count of active sessions during that hour. If a session crosses an hour boundary, it will be counted for each hour it is active. Therefore, the sum of all hourly session values on a chart may be larger than the total number of actual sessions during the entire time period.\n- **Exit %**: The percentage of sessions that ended with an intent during the selected time range.\n\nViews\n-----\n\nThere are multiple views that you can select on the analytics page.\nEach view differs by the type of data, the data filter, or the chart type.\nThe following subsections describe each view.\n\n### Overall view\n\nThis view charts session and interaction counts\nfor all requests.\n\n### Status codes view\n\nThis view charts interaction counts\nfor all requests\nby status code.\nThis includes all V2 API requests, whether successful or not.\nHovering your mouse over a data point shows a popup\nwith individual status code counts at that point.\nFor example:\n\n- **OK**\n- **PERMISSION_DENIED**\n- **INTERNAL**\n- **DEADLINE EXCEEDED**\n\n### Integrations view\n\nThis view charts session and interaction counts\nfor all requests (except Google Assistant)\nby\n[integration type](/dialogflow/docs/integrations).\nHovering your mouse over a data point shows a popup\nwith integration-specific counts at that point.\nAPI calls are shown as \"api\".\n\n### Webhook view\n\nThis view charts session and interaction counts\nfor all requests\nby number of requests with and without\n[webhook calls](/dialogflow/docs/fulfillment-webhook).\nHovering your mouse over a data point shows a popup\nwith individual counts at that point:\n\n- **Webhook called**\n- **Webhook not called**\n\n### Languages view\n\nThis view charts session and interaction counts\nfor all requests\nby\n[language](/dialogflow/docs/agents-multilingual).\nHovering your mouse over a data point shows a popup\nwith language-specific counts at that point.\n\n### Knowledge view\n\nThis view charts session and interaction counts\nfor\n[knowledge request](/dialogflow/docs/knowledge-connectors)\nby knowledge result data.\nHovering your mouse over a data point shows a popup\nwith individual counts at that point:\n\n- **Knowledge had result**\n- **Knowledge was used**\n- **Knowledge had primary result**\n\n### Sentiment view\n\nThis view charts session and interaction counts\nfor sentiment requests\nby sentiment result data.\nHovering your mouse over a data point shows a popup\nwith individual counts at that point.\n\n### Speech view\n\nThis view charts session and interaction counts\nfor speech requests\nby speech-to-text and text-to-speech.\nHovering your mouse over a data point shows a popup\nwith individual counts at that point:\n\n- **Speech to text**\n- **Text to speech**\n\n### Intents view\n\nThis view shows a table of [common metric values](#metrics)\nfor all requests by intent.\n\n### Intent path view\n\nThis view graphs *intent nodes* with connecting *intent path lines* .\nEach intent in your agent has one node.\nEach intent path line shows a frequency value for how often\none intent follows another intent in sessions for the selected time period.\nThe **session start** node has intent path lines to the initial intent matches.\nEach intent node has a frequency value inside its node box\nthat shows how often the intent ended a session for the selected time period.\nFor example, consider that you have three intents: **A** , **B** , and **C**:\n\n- If **A** is always the first intent matched in a session, the chart will show a 100% intent path line from **session start** to **A**.\n- If **B** is matched 30% of the time that **A** was matched in the previous interaction in the session, the chart will show a 30% intent path line from **A** to **B**.\n- If **C** is matched 70% of the time that **A** was matched in the previous interaction in the session, the chart will show a 70% intent path line from **A** to **C**.\n- If 40% of sessions end by matching **C** , the **C** intent node box will contain a 40% value.\n\nHovering your mouse over an intent node shows a popup\nwith metrics for the intent:\n\n- **Sessions start with this intent**: The count and percentage of sessions that started with this intent.\n- **Interactions matched this intent**: The count and percentage of interactions that matched this intent.\n- **Sessions end with this intent**: The count and percentage of sessions that ended with this intent.\n\nHovering your mouse over an intent path value or session start node\nalso shows additional information.\n\n### Session path view\n\nSimilar to the intent path view,\nthis view graphs *intent nodes* with connecting *intent path lines* .\nHowever, the intent path lines in this view show the frequencies\nas found in *complete paths* taken by common sessions for the agent.\nOne intent node may appear multiple times\nif it is matched in multiple paths or multiple times in a single path.\nYou can interact with this chart by clicking intent nodes to expand them.\n\nHovering your mouse over an intent node shows a popup\nwith metrics for the intent:\n\n- **Sessions followed this path prefix**: The count and percentage of sessions that followed the path up to the intent node.\n- **Ended at this point**: The percentage of sessions that ended on the path up to the intent node.\n\nAdditional data from Stackdriver\n--------------------------------\n\nIn addition to the data provided by the analytics page,\nyou can query for other types of data using Stackdriver.\nSee:\n\n- [`tag_consumed_api`](https://cloud.google.com/monitoring/api/resources#tag_consumed_api)\n- [Creating a Dashboard with Stackdriver SLI Monitoring Metrics](https://medium.com/google-cloud/creating-a-dashboard-with-stackdriver-sli-monitoring-metrics-eaf6d19386de)\n\nLimitations\n-----------\n\nThe following limitations apply:\n\n- [Google Assistant integration](/dialogflow/es/docs/integrations/aog) data is not supported.\n- It can take up to a day for data to appear in analytics."]]