本文档介绍了如何解决在使用 Workload Manager 中适用于 SAP 工作负载的可观测性服务时可能遇到的问题。
可观测性信息中心上未列出 SAP 系统 ID
为可观测性配置 Google Cloud的 Agent for SAP 并向托管 SAP 系统不同元素(例如 Central Services、应用服务器和 SAP HANA 数据库)的所有虚拟机的服务账号授予所需权限后,系统 ID 会显示在 SAP 可观测性信息中心上。如果未列出系统 ID,请按照以下部分中的说明检查代理配置和日志。
验证代理配置
您必须确保已为Google Cloud的 Agent for SAP 正确配置所有必需的功能。
如需获取代理实例的特征状态,请运行以下命令:
sudo /usr/bin/google_cloud_sap_agent status
此命令输出会总结已启用和已停用的功能。它还会指明任何缺失的 IAM 权限或配置问题。 如需了解详情,请参阅验证 Workload Manager 可观测性设置。
检查虚拟机实例日志
在虚拟机实例日志中,查看与 Agent for SAP 无法更新 SAP 系统信息相关的问题。 如需查看日志,请执行以下操作:
- 选择虚拟机以打开详细信息页面。
- 点击可观测性标签页以显示有关虚拟机的信息。
选择所有日志,然后按“错误”严重程度进行排序。
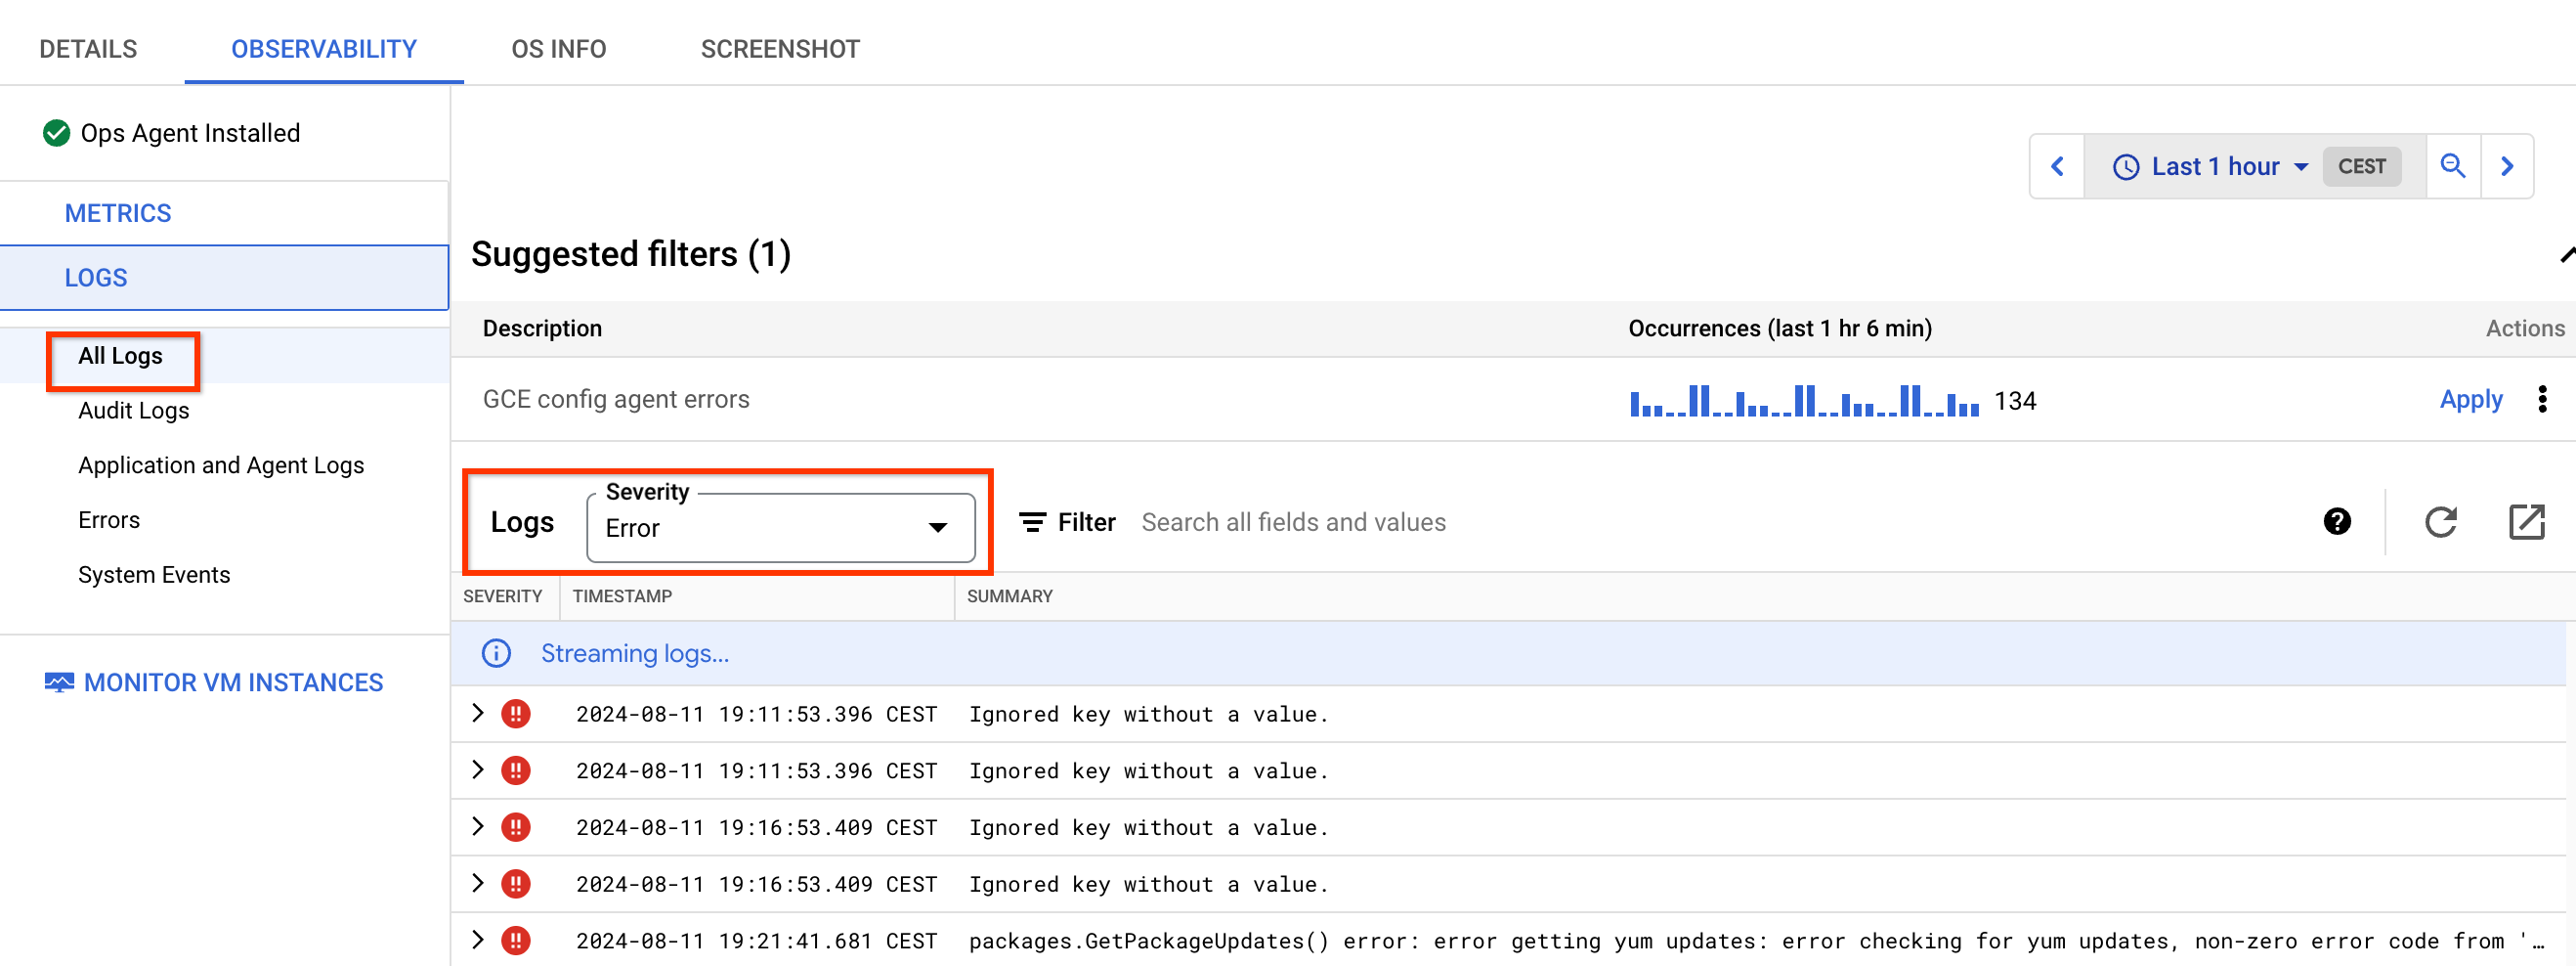
这些错误大多与附加到虚拟机的服务账号缺少权限有关。如需解决这些错误,请向服务账号授予必需的权限。
使用 Cloud Logging 查看日志
您必须确保 Agent for SAP 正确发现您的 SAP 工作负载。如需查看托管代理的虚拟机实例的日志条目,请执行以下操作:
在 Google Cloud 控制台中,选择日志记录,然后选择日志浏览器:
在查询窗格中,选择显示查询,然后输入以下查询:
jsonPayload.@type:"SapDiscovery"
如果您看不到托管代理的任何虚拟机的信息,则表示代理可能未配置或无法正常运行。如需了解详情,请参阅配置 Agent for SAP。
可选:如需查看与 Agent for SAP 上传 SAP 发现数据时进程相关的日志,请使用以下查询:
 -jsonPayload.caller=~"third_party/sapagent/internal/system/clouddiscovery/cloud_discovery.go"
 -jsonPayload.caller=~"third_party/sapagent/internal/system/sapdiscovery"
健康状况显示为“未指定”
SAP 系统的健康状况为未指定(灰色)可能存在多个根本原因。此健康状况用于识别因缺少指标或设置而无法被 Workload Manager 正确评估的系统。导致此健康状态的最常见原因如下:
Google Cloud的 Agent for SAP 可能已停止或错误地报告了所需的指标。如需了解详情,请参阅验证代理安装。
如果 Agent for SAP 正在运行,但系统状态为 Unspecified,请检查代理中的进程监控和 SAP HANA 监控功能是否已启用,并根据虚拟机上运行的 SAP 进程正确配置。Central Services 和应用服务器需要启用 Process Monitoring,而 SAP HANA 数据库需要启用 Process Monitoring 和 SAP HANA Monitoring。
- 快速变化的 Process Monitoring 指标和缓慢变化的 Process Monitoring 指标的默认收集频率分别为 5 秒和 30 秒。如果这些值增加到高于默认值,您可能会看到健康状况为未指定。
在“系统概览”页面上,检查系统是否正确识别了架构和规模类型。如果这两个参数中的任何一个或两个都不正确,则Google Cloud的 Agent for SAP 或上传到 Google Cloud的 SAP 数据存在潜在问题。如需进一步分析,请与 Cloud Customer Care 联系。请参阅获取 Google Cloud的 Agent for SAP 支持。
由于指标
workload/sap/nw/instance/role或workload/sap/hana/ha/availability无法正常工作或缺失,系统无法正确识别与每个虚拟机相关的角色。在“应用和数据库”信息中心的虚拟机列表中,检查已识别的 SAP 角色。每种架构类型都需要以下角色:
- 集中式架构:中央服务、应用服务器和 SAP HANA 主节点。
- 分布式架构:中央服务、应用服务器和 SAP HANA 主节点。
- 分布式高可用性:中央服务、ERC、应用服务器、SAP HANA 主实例和 SAP HANA 辅助实例。
列表中的所有虚拟机都应分配有角色。
通过以下方式验证必需的指标是否具有有效值:检查 Cloud Monitoring 中的指标,或使用 timeSeries API 方法获取 Agent for SAP 推送的最新值。如果 Cloud Monitoring 中不存在相应指标或该指标没有值,则健康状况会标记为未指定,因为没有足够的数据来评估该指标。
在采用分布式高可用性架构的集群中,检查是否存在失败的操作,并通过运行以下命令执行清理:
RHEL
pcs resource cleanup RESOURCE_ID
SLES
crm resource cleanup RESOURCE_ID
将
RESOURCE_ID替换为集群中失败资源的 ID。集群中的失败操作可能会影响指标
workload.googleapis.com/sap/cluster/nodes和workload.googleapis.com/sap/cluster/resources,并导致报告的值不正确。检查 Google Cloud的 Agent for SAP 版本是否为最新版本,以及您是否正在运行最新版本。较新版本的代理包含针对与可观测性指标相关的问题和 bug 的修复。 不正确的指标可能会导致系统健康状况为未指定。
对于复制到辅助站点的 SAP HANA 数据库,请检查主站点和辅助站点之间是否存在有效的集群配置。