剖析多切片環境
Cloud TPU Multislice 環境由多個 TPU 配量組成,這些配量透過資料中心網路 (DCN) 通訊。您可以使用 XProf 中的 Megascale 統計資料工具,查看 Multislice 環境使用 DCN 網路的效率。具體來說,Megascale 統計資料工具可讓您:
- 根據收集到的資料,查看及瞭解切片間的網路效能
- 找出效能瓶頸
- 提升模型效能
巨量規模統計資料工具中的所有指標都是以每個 TPU 為基礎產生。如要啟用這項工具,請按照相同的步驟在架構中擷取設定檔,並使用 XProfiler 程式庫設定 TensorBoard XProf 執行個體,以便查看設定檔。只要工作負載是以多切片工作負載的形式執行,TensorBoard 就會為所有多切片工作負載顯示「Megascale stats」工具。
如要進一步瞭解 XProf 中的 Megascale 統計資料工具,請參閱 Megascale 統計資料工具指南。
術語
DCN 集體統計資料工具會顯示指標,說明 Multislice 環境中 TPU 節點之間的通訊。當 TPU 執行階段啟動切片間通訊時,會使用一系列作業:
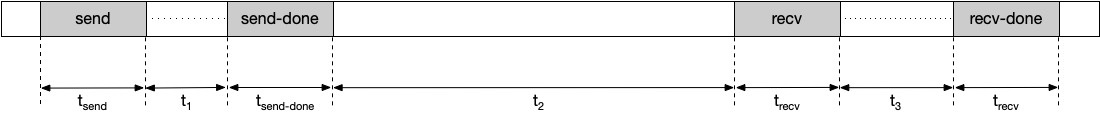
send:中斷主機以啟動直接記憶體存取 (DMA),並提供填滿的緩衝區給主機,以啟動資料移轉。send-done:向主機發出信號,表示資料移轉已完成。recv:提供空白緩衝區,供主機填入轉移的資料。recv-done:向主機發出信號,表示已收到資料。
send 作業發生時,即會啟動集合作業,並在發生相符的 recv-done 作業時完成。
Slack Time
集體可傳送及接收資料的時間長度。
這不包括 send、send-done、recv 或 recv-done 作業。舉例來說,假設有以下時間軸:
在本範例中,寬裕時間的計算方式如下:
寬裕時間 = t1 + t2 + t3
增加閒置時間可減少集體 TPU 停滯的機率。您可以選擇其他分片方法,增加閒置時間。
停滯時間
集體在傳送、傳送完成、接收和接收完成作業中花費的平均時間長度。請注意,這不包括傳輸資料所花費的時間。舉例來說,假設有以下時間軸:
在本例中,停滯時間的計算方式如下:
停滯時間 = tsend + tsend-done + trecv + trecv-done
觀察到的時間長度
send 和 recv-done 作業之間的時間長度,包括傳送和接收資料的時間。舉例來說,假設有以下時間軸:
觀察到的時間長度計算方式如下:
觀察到的時間長度 = tsend + t1 + tsend-done + t2 + trecv + t3 + trecv-done
發生次數
在個人資料存續期間,集體創作活動啟動並完成的次數。當發生 send 作業時,就會啟動集合,並在發生相符的 recv-end 作業時完成。send 作業及其相符的 recv-done 作業必須在設定檔持續時間內發生,才會納入這項指標。
總停頓次數
在設定檔期間,集合體使 TPU 停滯的總時間量。匯總總攤位數的計算方式如下:
匯總總停頓時間 = 停頓時間 * 發生次數
傳輸的資料大小
在設定檔期間,集體透過網路傳輸的資料量。
所需頻寬
在提供的鬆弛時間內傳輸資料所需的頻寬。您可以使用這項指標,查看設定檔期間內爭取網路頻寬的集合數量。所需頻寬的計算方式如下:
所需頻寬 = 傳輸資料大小 / 閒置時間
工具狀態
下表列出 DCN Collective Stats 工具中顯示的各項指標,以及所需的 TensorFlow 或 TPU 執行階段版本。
| DCN 集合統計資料 | TPU 執行階段版本支援的 TensorFlow |
|---|---|
| Slack 時間 | TensorFlow 2.15.0、TensorBoard 2.15.1 和 TensorBoard 外掛程式設定檔 2.15.0 |
| 停滯時間 | TensorFlow 2.15.0、TensorBoard 2.15.1 和 TensorBoard 外掛程式設定檔 2.15.0 |
| 觀察到的時間長度 | TensorFlow 2.15.0、TensorBoard 2.15.1 和 TensorBoard 外掛程式設定檔 2.15.0 |
| 發生次數 | TensorFlow 2.15.0、TensorBoard 2.15.1 和 TensorBoard 外掛程式設定檔 2.15.0 |
| 總停頓次數 | tf-nightly、tb-nightly、tbp-nightly |
| 傳輸的資料大小 | tf-nightly、tb-nightly、tbp-nightly |
| 所需頻寬 | tf-nightly、tb-nightly、tbp-nightly |
如何分析 DCN 集合統計資料工具
執行 TensorBoard 伺服器,然後前往「設定檔」分頁。
在 DCN 集合統計資料工具中,依「匯總總停滯」遞減排序表格。
找出匯總總停滯最高的 DCN 集體名稱。如果這個集合的匯總停滯時間明顯高於其他集合,可能表示 DCN 集合有瓶頸。
將 DCN 集體所需的頻寬乘以核心數。 每個 v4 TPU 主機有 8 個核心,因此集合所需的頻寬是顯示值的 8 倍。如果所需頻寬大於 TPU 的最大網路頻寬,可能表示網路壅塞。如要降低所需頻寬,請試著變更使用的分片機制。如要進一步瞭解分片機制,請參閱 Cloud TPU Multislice 總覽。
產生 HLO 傾印,判斷是否有任何編譯器問題。最好將
send和recv-done作業分散到集合中,以便排定更多重疊的 HLO 作業。重疊更多 HLO 運算可減少 TPU 停滯時間。在 DCN 集合的追蹤記錄檢視器中,檢查
recv-done作業的持續時間,該集合的匯總總停滯時間最長。如果傳輸時間很長,可能是因為網路頻寬不足,導致recv-done作業通常會遭到封鎖,無法取得資料。如果
recv-done作業的持續時間與閒置時間相比不會太長,可能表示有硬體問題。