Viewing historical trends
This page describes Cloud Profiler's history view. It is intended for developers who want to understand how a function's average resource usage changes over time.
Before you begin
This feature displays data for the most recent 30 days. If your service is newly deployed or if it hasn't been deployed for at least 30 days, these charts might be empty or incomplete.
Opening the history view
There are different ways you can view the history of resource usage for functions in your service.
Viewing the history of multiple functions
To display the average usage for multiple functions, click History show_chart:

By default, this view displays the history for the 5 functions that have the highest average usage. You can configure this view to display, or to hide, specific functions:

Viewing the history of a specific function
To view the average usage for a specific function, do one of the following:
- In the flame graph, place your pointer on a frame that contains the function of interest, and then click Show History in the frame's tooltip.
- Click List list, identify the function of interest, select Actions more_vert, and then select Show History.
Understanding the charts
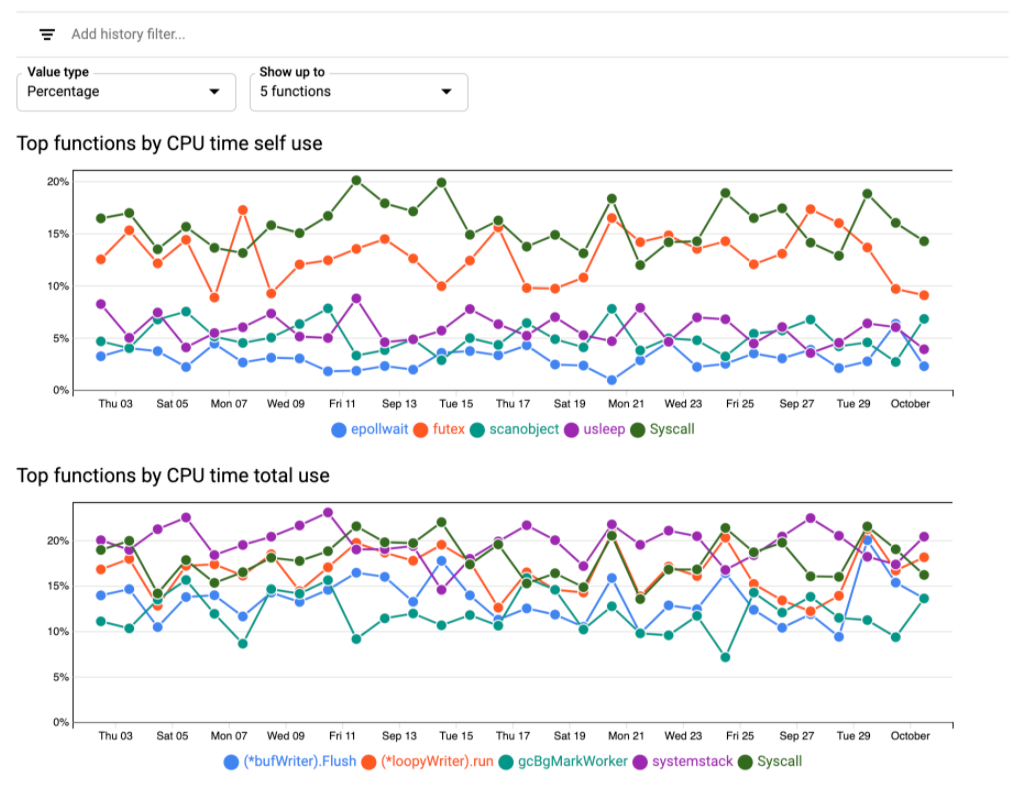
Each line in a chart displays the history of resource usage for a specific function. The charts display 30 days of data. The most recent data point on the charts is for the previous day.
The Value type menu lets you display the profile data as a percentage of the resource usage for all functions or as the absolute value in the metric's units. The absolute usage for a function is determined by computing the ratio of its total resource usage across all profiles in a 24-hour period to the number of profiles in that period.
The Show up to menu lets you configure the maximum number of functions to display. By default, this value is set to 5 functions.
The chart title indicates whether the chart displays the self usage or the total
usage. The title also identifies the resource whose history data is displayed.
In the previous screenshot, the chart titles indicate that CPU time data is
shown.
The chart legend lists the names of the functions whose resource usage is displayed.
Manipulating the chart
To highlight data for a specific function, hold the pointer over the function name in the legend.
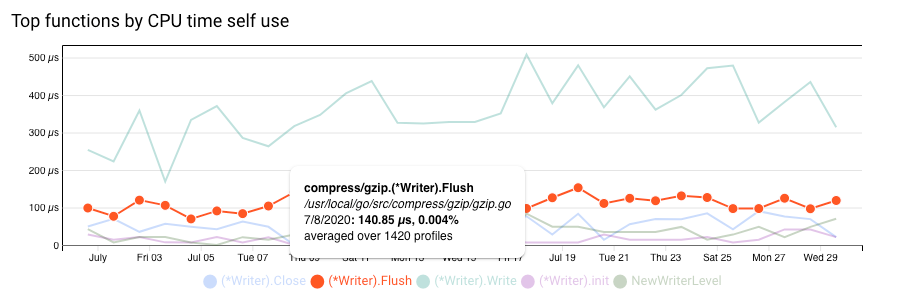
To view detailed information about a data point, hold the pointer over the data point to activate the tooltip:

As illustrated in the previous screenshot, the tooltip displays the following:
- Function name
- Function filename
- Date
- Absolute usage and percentage usage
- Number of profiles used to generate the data point
Filtering the charts
To show or hide functions, you use filters. The filters accept a regular expression as the filter value and the matches are case-sensitive. The regular expression is compared against all function names and all filenames.
To add a filter, click Add history filter, select an option from the list, and then enter the value for the filter.
| Filter | Description |
|---|---|
| Show | To display functions whose name or whose filename matches a RE2 regular expression, add this filter with the value set to the regular expression. If you add multiple |
| Hide | To hide from the display all functions whose name or whose filename matches a regular expression, add this filter with value set to the regular expression. If you add multiple |
Troubleshooting
This section lists issues that are specific to the history view. For help with other Profiler problems, see the general Troubleshooting section.
| Behavior | Cause | Solution |
|---|---|---|
| One or more functions are missing some data points. | The charts display historical data for 30 days. If data isn't available for a day, no datapoint is added to the chart, and that can result in a partially empty chart. | Missing data isn't an error condition. |
The chart is blank and the message
No data is available for the filter selections.
|
For a newly deployed service, no historical data is available to be displayed. If filters have been applied, then it's possible that the
combination of filters eliminates the display of data for all
functions in the service. For example, if the filters
|
For a newly deployed service, the history view is expected to be empty. If filters have been applied, then ensure that the combination of filters doesn't eliminate all possible functions. |
