Cloud Profiler overview
Understanding the performance of production systems is notoriously difficult. Attempting to measure performance in test environments usually fails to replicate the pressures on a production system. Microbenchmarking parts of your application is sometimes feasible, but it also typically fails to replicate the workload and behavior of a production system.
Continuous profiling of production systems is an effective way to discover where resources like CPU cycles and memory are consumed as a service operates in its working environment. But profiling adds an additional load on the production system: in order to be an acceptable way to discover patterns of resource consumption, the additional load of profiling must be small.
Cloud Profiler is a statistical, low-overhead profiler that continuously gathers CPU usage and memory-allocation information from your production applications. It attributes that information to the source code that generated it, helping you identify the parts of your application that are consuming the most resources, and otherwise illuminating your applications performance characteristics.
Types of profiling available
Cloud Profiler supports different types of profiling based on the language in which a program is written. The following table summarizes the supported profile types by language:
| Profile type | Go | Java | Node.js | Python |
|---|---|---|---|---|
| CPU time | Y | Y | Y | |
| Heap | Y | Y | Y | |
| Allocated heap | Y | |||
| Contention | Y | |||
| Threads | Y | |||
| Wall time | Y | Y | Y |
For complete information on the language requirements and any restrictions, see the language's how-to page. For more information about these profile types, see Profiling concepts.
Supported configurations
When you instrument your application to capture profile data, you include a language-specific profiling agent. The following table summarizes the supported environments:
| Environments | Go | Java | Node.js | Python |
|---|---|---|---|---|
| Compute Engine | Y | Y | Y | Y |
| Google Kubernetes Engine | Y | Y | Y | Y |
| App Engine flexible environment | Y | Y | Y | Y |
| App Engine standard environment | Y | Y | Y | Y |
| Dataproc | Y | |||
| Dataflow | Y | Y | ||
| Outside of Google Cloud | Y | Y | Y | Y |
The following table summarizes the supported operating systems:
| Operating systems | Go | Java | Node.js | Python |
|---|---|---|---|---|
Linuxglibc implementation of the standard C library |
Y | Y | Y | Y |
Linuxmusl implementation of the standard C library |
Y | Y (Alpha) | Y | Y (Alpha) |
Performance impact
Cloud Profiler creates a single profile by collecting profiling data, usually for 10 seconds, every 1 minute for a single instance of the configured service in a single Compute Engine zone. If, for example, your GKE service runs 10 replicas of a pod, then, in a 10-minute period, roughly 10 profiles are created, and each pod is profiled approximately once. The profiling period is randomized, so there is variation. See Profile collection for more information.
The overhead of the CPU and heap allocation profiling at the time of the data collection is less than 5 percent. Amortized over the execution time and across multiple replicas of a service, the overhead is commonly less than 0.5 percent, making it an affordable option for always-on profiling in production systems.
Components
Cloud Profiler consists of the profiling agent, which collects the data, and a console interface on Google Cloud, which lets you view and analyze the data collected by the agent.
Profiling agent
You install the agent on the virtual machines where your application runs. The agent typically comes as a library that you attach to your application when you run it. The agent collects profiling data as the app runs.
For information on running the Cloud Profiler agent, see:- Profiling Go applications
- Profiling Java applications
- Profiling Node.js applications
- Profiling Python applications
- Profiling applications running outside Google Cloud
Profiler interface
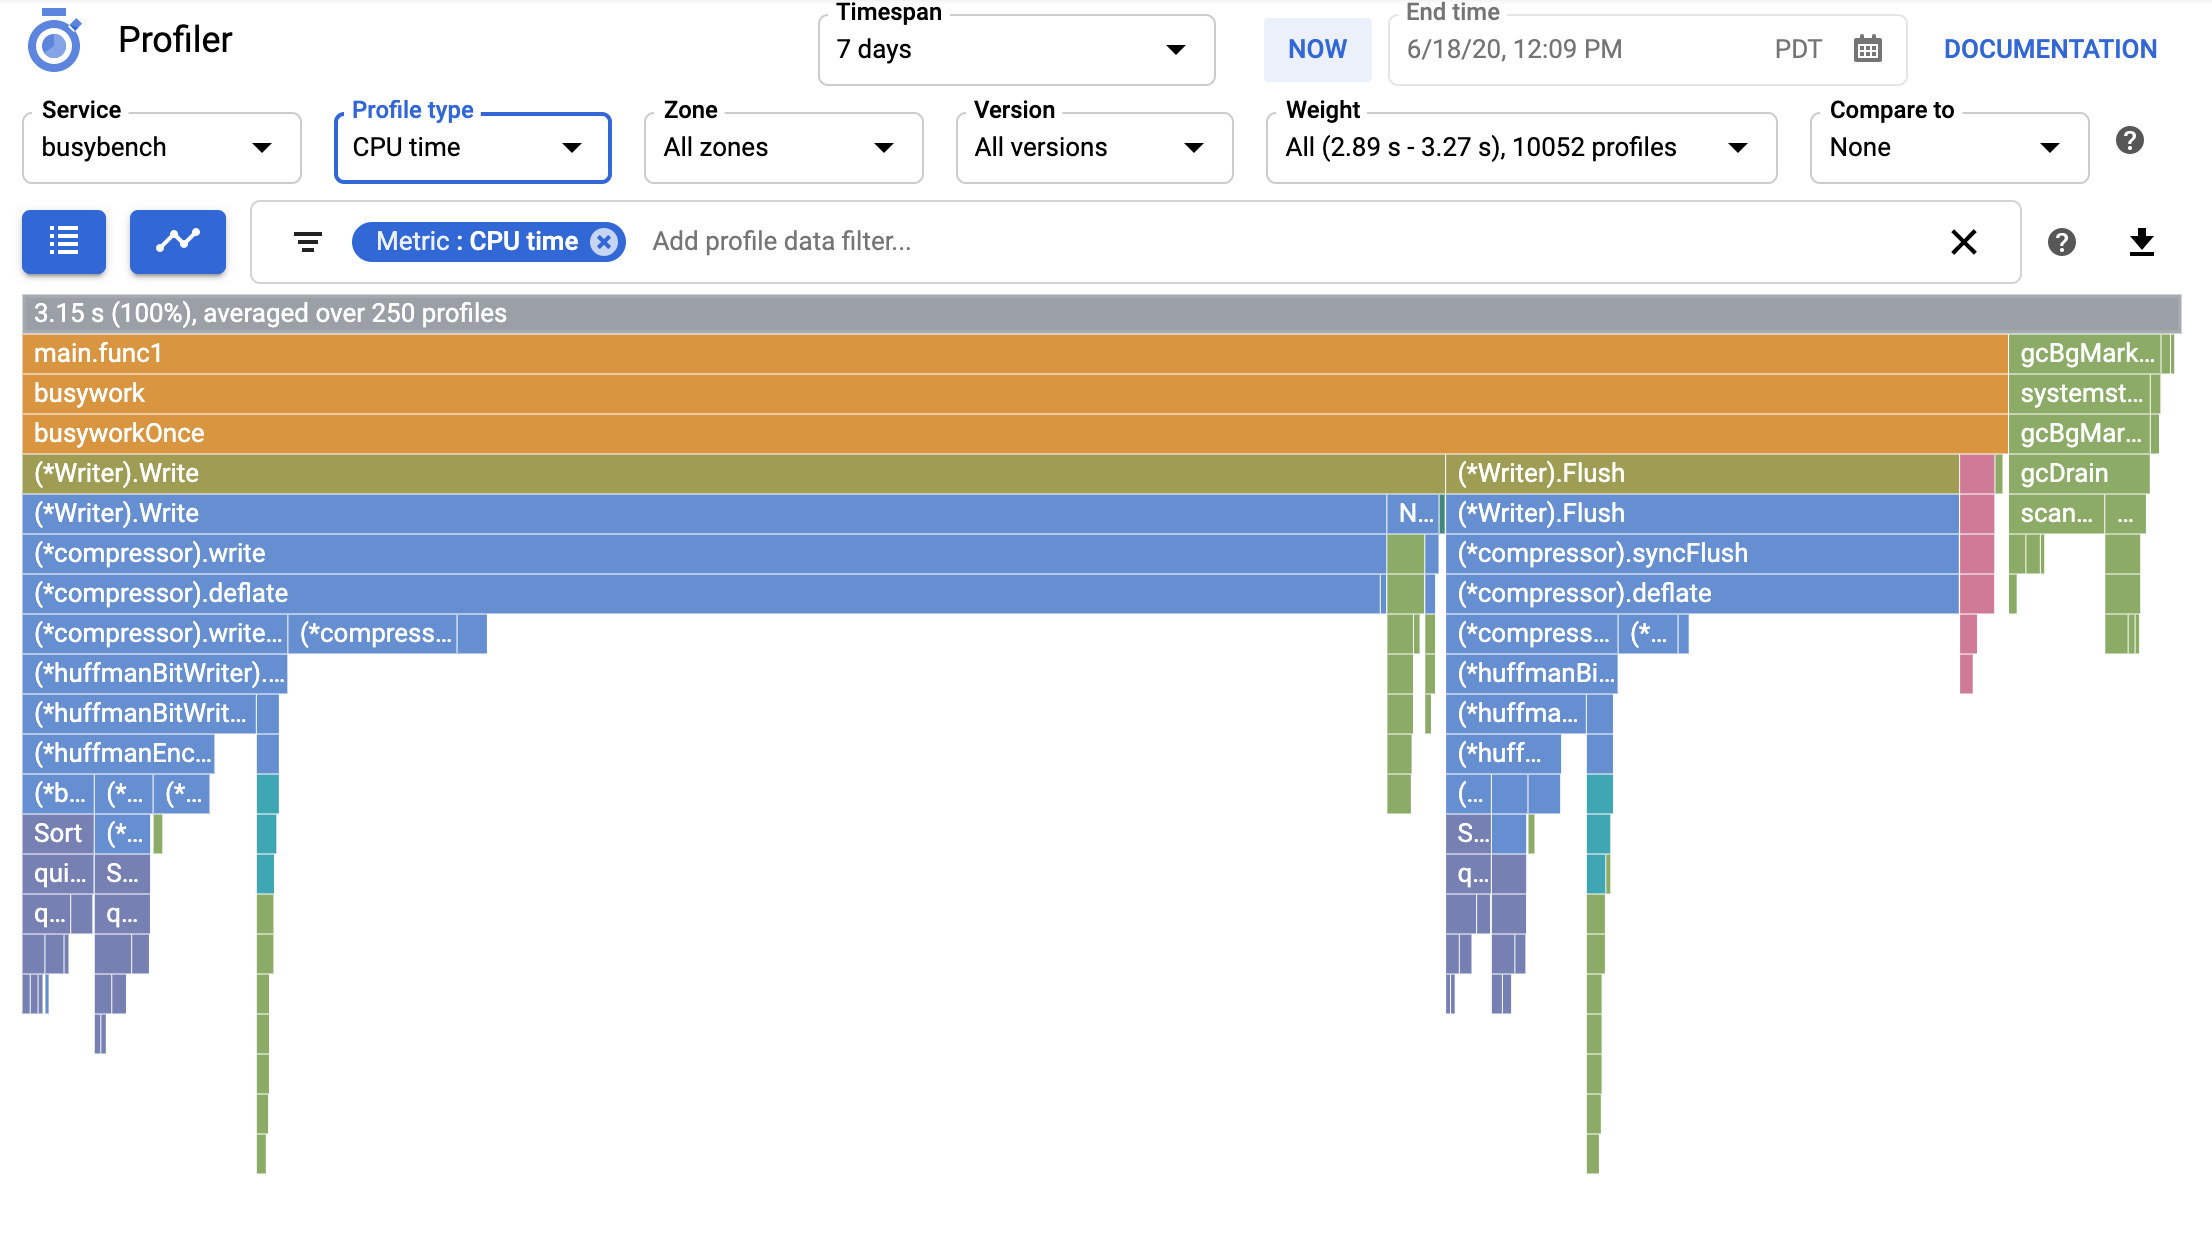
After the agent has collected some profiling data, you can use the Profiler interface to see how the statistics for CPU and memory usage correlate with areas of your application.

The profile data is retained for 30 days, so you can analyze performance data for periods up to the last 30 days. Profiles can be downloaded for long-term storage.
Quotas and limits
For information on viewing and managing your Profiler quotas, see Quotas and limits.
Data security
Cloud Profiler is a VPC Service Controls supported service. For more information, see VPC Service Controls documentation.
