이 사용 사례에서 여러 부하 분산 애플리케이션이 포함된 네트워크를 지원하는 네트워크 관리자라고 가정합니다. 지연 시간 문제에 대한 알림을 받았으며 조직의 모바일 애플리케이션이 간헐적으로 느리고 시간이 초과되었다는 메시지를 받았습니다. 여러 사용자가 영향을 받고 있으며 최근에 애플리케이션을 배포하지 않았음을 알고 있습니다. 이 문제는 애플리케이션이 아닌 환경의 변화와 관련이 있을 수 있습니다.
다음 사용 사례에서는 네트워크 토폴로지를 사용하여 배포 문제를 신속하게 해결하고 조사할 수 있는 방법을 보여줍니다.
토폴로지 세부정보
배포는 Google Cloud 리전 세 개(us-central1,
europe-west1, asia-east1)에 걸쳐 있습니다. 모든 외부 클라이언트 요청은 리전 세 개 각각에 백엔드가 여러 개 있는 단일 외부 애플리케이션 부하 분산기에서 처리됩니다. 3개의 비즈니스 리전(미주, EMEA, APAC) 중 하나에서 온 클라이언트 요청은 가장 가까운Google Cloud 리전의 애플리케이션 인스턴스에서 제공됩니다.
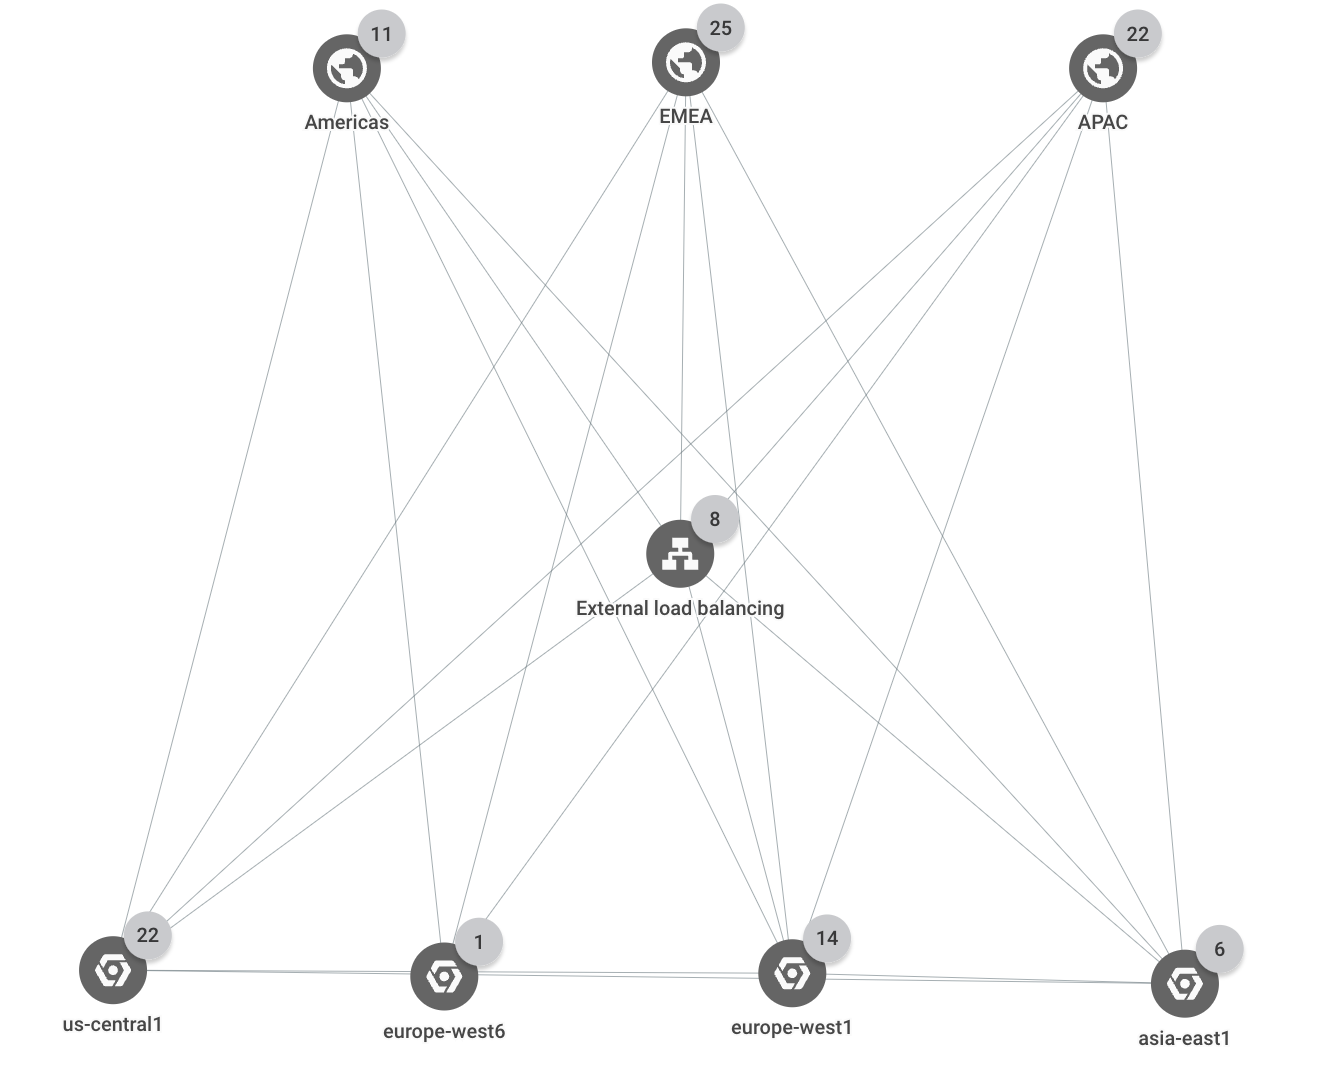
다음 토폴로지는 배포의 최상위 계층 구조를 보여줍니다.
네트워크 토폴로지 예시 토폴로지(확대하려면 클릭)
네트워크 지연 시간
이 시나리오에서는 이름이 shopping-site-lb인 부하 분산기가 있다고 가정합니다.
외부 클라이언트와 로드 밸런서 간의 지연 시간을 확인하여 클라이언트 간의 지연 시간이 변경되었는지 확인합니다. 부하 분산기의 백엔드를 추가로 조사하기로 결정했습니다.
외부 부하 분산기 shopping-site-lb에 대한 트래픽만 표시하도록 토폴로지를 필터링합니다.
필터를 적용하면 다음 예시와 같이 네트워크 토폴로지에 부하 분산기와 관련된 연결만 표시됩니다.
부하 분산기 필터(확대하려면 클릭)
미주 지역의 외부 클라이언트부터 시작하여 미주 비즈니스 리전과 부하 분산기 사이의 트래픽 측정항목을 클릭합니다.
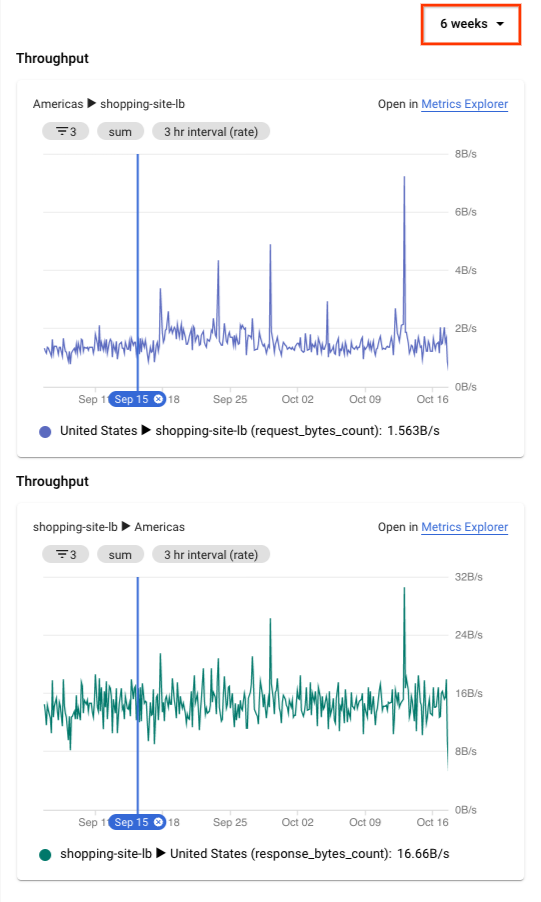
네트워크 토폴로지는 세부정보 창에 차트를 표시합니다. 이 정보에는 선택한 항목과 연결된 항목 간의 인그레스 및 이그레스 트래픽이 포함됩니다. 예를 들어 네트워크 토폴로지는 초당 쿼리 수(QPS) 및 HTTP 요청 지연 시간에 대한 최신 값을 제공합니다.
요청 지연 시간 차트에는 50번째, 95번째, 99번째 백분위수 값이 표시됩니다. 이 예시에서는 모든 지연 시간 값이 예상보다 높다고 가정합니다.
시계열 차트를 6주로 확장하려면 세부정보 창 상단에서 6주를 선택합니다.
차트 확장 1(확대하려면 클릭)
1그림은 참조용입니다. 데이터에는 사용 사례가 반영되어 있지 않습니다.
약 2시간 전에 발생한 첫 번째 문제가 보고되었을 때 크게 증가한 것을 확인했습니다. 이 문제는 부하 분산기의 지연 시간 증가와 관련이 있다고 확신합니다.
문제를 개략적으로 파악하고 Google Cloud 콘솔의 부하 분산 페이지로 이동하여 부하 분산기를 더 자세히 조사합니다. 최종적으로 부하 분산기의 백엔드 서비스에 있는 인스턴스가 응답하는 데 평소보다 시간이 오래 걸리고 있습니다. 이 인스턴스를 서비스에서 제거하면 문제가 해결됩니다.
[[["이해하기 쉬움","easyToUnderstand","thumb-up"],["문제가 해결됨","solvedMyProblem","thumb-up"],["기타","otherUp","thumb-up"]],[["이해하기 어려움","hardToUnderstand","thumb-down"],["잘못된 정보 또는 샘플 코드","incorrectInformationOrSampleCode","thumb-down"],["필요한 정보/샘플이 없음","missingTheInformationSamplesINeed","thumb-down"],["번역 문제","translationIssue","thumb-down"],["기타","otherDown","thumb-down"]],["최종 업데이트: 2025-09-04(UTC)"],[],[],null,["# Use case: Troubleshoot network connectivity\n===========================================\n\nIn this use case, you're a network administrator supporting a network that\nincludes several load-balanced applications. You've been alerted of a latency\nproblem and have been told that your organization's mobile application is\nintermittently slow and timing out. You know that a number of different users\nare affected, and that there have been no recent application deployments. The\nissue is likely related to a change in the environment and not the application.\n\nThe following use case demonstrates how Network Topology can help you\nquickly troubleshoot and investigate issues in your deployment.\n\nTopology details\n----------------\n\nThe deployment spans three Google Cloud regions (`us-central1`,\n`europe-west1`, and `asia-east1`). All external client requests are served by a\nsingle external Application Load Balancer that has multiple backends in each of the three\nregions. Client requests that come from one of three business regions (Americas,\nEMEA, and APAC) are served by application instances in the closest\nGoogle Cloud region.\n\nThe following topology shows the top-level hierarchy for the deployment:\n[](/static/network-intelligence-center/docs/network-topology/images/use-cases/auditing-topology.png) Network Topology example topology (click to enlarge)\n\nNetwork latency\n---------------\n\nIn this scenario, assume that you have a load balancer named `shopping-site-lb`.\nYou check the latency between external clients and the load balancer to see if\nthe latency between them has changed. You discover that it has and decide to\nfurther investigate the load balancer's backends.\n\n1. You filter the topology to show only the traffic for your external load balancer\n `shopping-site-lb`.\n\n After you apply the filter, Network Topology shows only the\n connections related to the load balancer, as shown in the following example.\n [](/static/network-intelligence-center/docs/network-topology/images/use-cases/auditing-filter.png) Filter for a load balancer (click to enlarge)\n2. Starting with the external clients in Americas, you click the traffic metrics\n between the Americas business region and the load balancer.\n\n Network Topology shows charts in the details pane. The\n information includes ingress and egress traffic between your selected\n entity and the connected entity. For example, Network Topology\n provides the latest values for queries per second (QPS) and the HTTP request\n latency.\n\n In the request latency chart, you see values for the 50th, 95th, and 99th\n percentiles. In this example, assume that all of the latency values are\n higher than you expected.\n3. To expand the time series charts to 6 weeks, at the top of the details pane, you select\n **6 weeks**.\n\n [](/static/network-intelligence-center/docs/network-topology/images/use-cases/troubleshooting-zoom.png) Expanding the chart^1^ (click to enlarge) \n\n ^1^The figure is for reference. Its data doesn't reflect the use\n case.\n\n You see a significant jump that happened about two hours ago, roughly when\n the first issues were reported. You're confident that the issue is related\n to increased latency with the load balancer.\n4. Having a high-level view of the issue, you investigate the load balancer\n further by going to the **Load balancing** page in the Google Cloud console. You\n eventually find that an instance in the load balancer's backend service was\n taking longer than normal to respond. You take that instance out of service,\n which resolves the issue.\n\nWhat's next\n-----------\n\n- [Monitor your networking configuration with Network Topology](/network-intelligence-center/docs/network-topology/how-to/audit-troubleshoot-networking-issues)\n- [Use case: Audit network performance](/network-intelligence-center/docs/network-topology/concepts/auditing-network-performance)\n- [Troubleshoot Network Topology](/network-intelligence-center/docs/network-topology/support/troubleshooting)"]]