이 페이지에서는 Memcached 인스턴스의 성능을 모니터링하는 방법을 설명합니다.
모니터링을 하면 인스턴스가 원하는 대로 작동하는지 확인할 수 있습니다. 이 가이드에서는 Memcached 인스턴스 모니터링의 몇 가지 기본 예를 설명합니다. 여기에서 다루는 모니터링 유형 외에도 Memorystore for Memcached는 오픈소스 Memcached와 호환되므로 Compute Engine VM의 기존 Memcached 모니터링 도구를 사용하여 인스턴스를 모니터링할 수 있습니다.
Google Cloud 콘솔에서 인스턴스 모니터링
인스턴스의 핵심 측정항목을 보려면 다음 단계를 따르세요.
- Google Cloud 콘솔에서 Memorystore for Memcached 페이지로 이동합니다.
Memorystore for Memcached - 확인할 인스턴스의 인스턴스 ID를 클릭합니다.
Google Cloud 콘솔에서 인스턴스의 인스턴스 세부정보 페이지를 방문하여 여러 측정항목을 모니터링할 수 있습니다. 기본적으로 그래프에는 인스턴스의 현재 메모리 사용량과 최대 용량이 표시됩니다.Google Cloud 콘솔에서 사용할 수 있는 다른 측정항목으로는 활성 연결, 메모리 사용량, CPU 사용 시간, 적중률, 항목, 제거 수, 작업 수, 수신 바이트, 전송 바이트, 업타임, 사용되지 않은 메모리, 작업 가져오기, 작업 설정, 삭제 작업이 있습니다.
그래프에 표시된 측정항목을 변경하려면 왼쪽 상단의 드롭다운을 사용하세요. 기간을 변경하려면 그래프의 오른쪽 상단 모서리에서 다른 기간을 선택하세요.
Cloud Monitoring 사용
Cloud Monitoring은 Memcached 인스턴스의 업타임과 같은 측정항목을 볼 수 있는 모니터링 서비스입니다. Cloud Monitoring에서 사용할 수 있는 모든 Memorystore for Memcached 측정항목에 대한 자세한 내용은 Monitoring 참조 문서를 확인하세요.
Cloud Monitoring 가입
모니터링 콘솔에 액세스하려면Google Cloud 콘솔 탐색창에서 모니터링을 클릭합니다.
가격 정보는 Cloud Monitoring 가격책정을 참조하세요.
Monitoring에서 인스턴스 업타임, 재시작, 장애 조치 정보보기
인스턴스 업타임 정보를 보려면 측정항목 탐색기를 사용하세요.
Google Cloud 콘솔로 이동하여 로그인하고 Memcached 인스턴스가 있는 프로젝트로 이동합니다.
왼쪽 탐색 메뉴에서 모니터링을 선택합니다.
모니터링에서 탐색창이 펼쳐져 있지 않으면 펼치기last_page를 클릭합니다. 이 버튼은 콘솔의 왼쪽 하단에 있습니다.
탐색창에 측정항목 탐색기가 표시되면 측정항목 탐색기를 클릭합니다. 아니면 리소스를 선택한 다음 측정항목 탐색기를 선택합니다.
리소스 유형 및 측정항목 찾기 필드에
memcache.googleapis.com/node/uptime을 입력합니다.
그래프는 다음과 같이 표시됩니다.
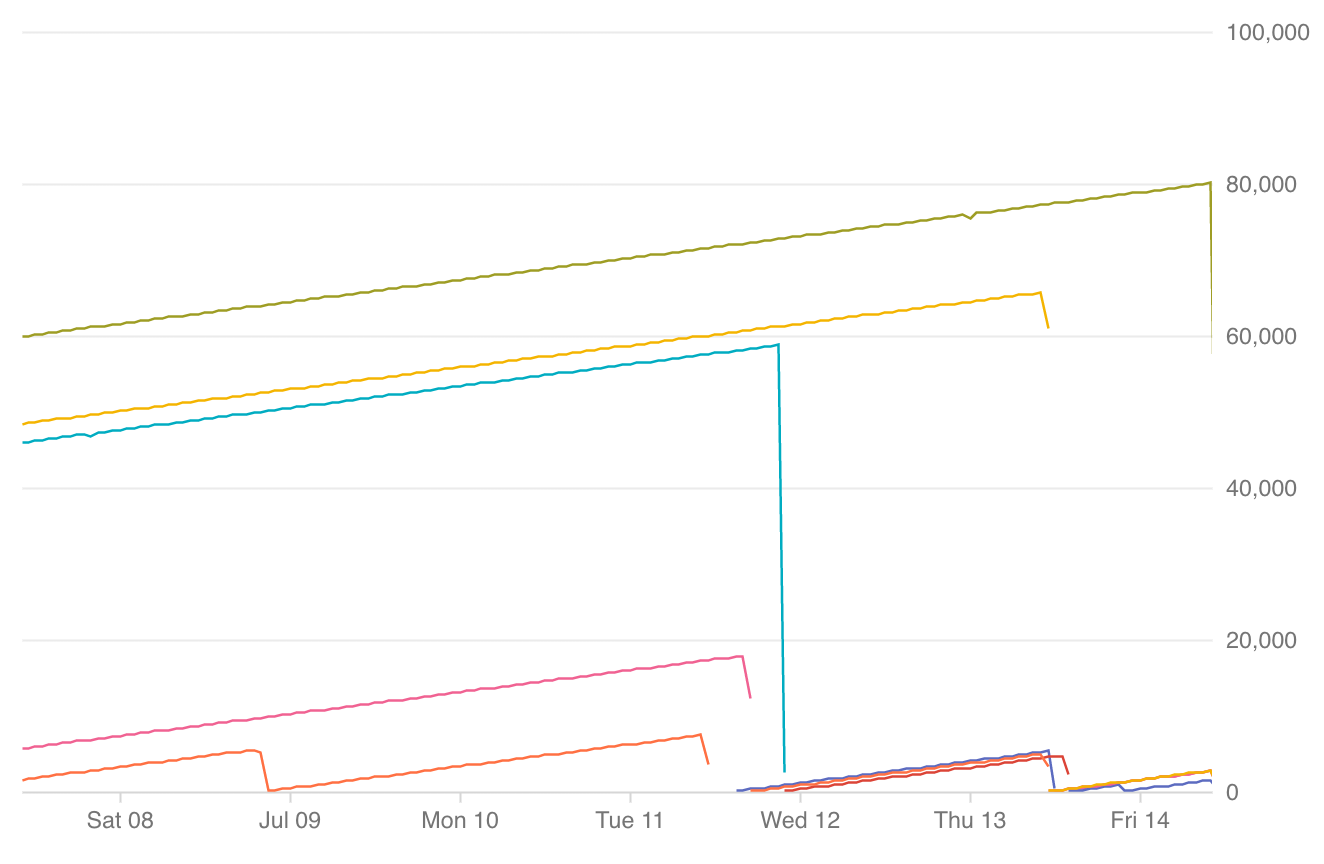
- 각 선은 단일 인스턴스를 나타냅니다.
- 방향이 오른쪽으로 올라가면 Memcached가 작동 중임을 나타냅니다.
- 방향이 아래로 떨어지면 다시 시작함을 나타냅니다.
- 누락된 데이터는 사용할 수 없음을 나타냅니다.
- 그래프 아래에는 각 선이 속하는 인스턴스를 나타내는 색으로 구분된 키가 있습니다. 키 위로 마우스를 가져가면 그래프에서 해당 선이 강조표시됩니다.
오른쪽 상단 모서리에 있는 시간대를 변경할 수 있으며 표시되는 정보를 특정 리전, 프로젝트, 인스턴스 또는 노드에 맞게 조정할 수 있습니다.
초당 작업 보기
인스턴스의 초당 작업 수를 보려면 측정항목 탐색기를 사용하세요.
Google Cloud 콘솔로 이동하여 로그인하고 Memcached 인스턴스가 있는 프로젝트로 이동합니다.
왼쪽 탐색 메뉴에서 모니터링을 선택합니다.
모니터링에서 탐색창이 펼쳐져 있지 않으면 펼치기last_page를 클릭합니다. 이 버튼은 콘솔의 왼쪽 하단에 있습니다.
탐색창에 측정항목 탐색기가 표시되면 측정항목 탐색기를 클릭합니다. 아니면 리소스를 선택한 다음 측정항목 탐색기를 선택합니다.
리소스 유형으로 Memcached 인스턴스를 선택합니다.
리소스 유형 및 측정항목 찾기 필드에
memcache.googleapis.com/node/operation_count를 입력합니다.집계 드롭다운 메뉴에서 합계를 선택합니다.
Memcached 메모리 사용량을 모니터링하도록 대시보드 만들기
Google Cloud 콘솔에서 Monitoring을 선택하거나 다음 버튼을 사용합니다.
대시보드 > 대시보드 만들기를 선택합니다.
대시보드의 이름(예: 'Memcached 대시보드')을 입력하고 확인을 클릭합니다.
차트 추가를 클릭합니다.
차트 제목을 제공합니다. 예를 들어 'Memcached 메모리 사용량'과 같이 입력합니다.
리소스 유형 및 측정항목 찾기라고 표시된 검색창에서 'Memorystore Memcached 노드'를 검색하고 측정항목을 선택합니다.
- 측정항목 유형으로 '캐시 메모리'를 입력합니다.
- 필터 상자에서 instance_id에 대한 필터를 추가하고 모니터링할 인스턴스를 선택합니다.
- 프로젝트의 모든 Memorystore 인스턴스 사용량을 모니터링하려면 그룹화 기준을 사용하고 instance_id를 선택합니다.
- 측정항목 유형으로 '캐시 메모리'를 입력합니다.
저장을 클릭합니다. Monitoring UI의 대시보드 탭에서 이 대시보드에 액세스할 수 있습니다.
측정항목에 대한 Monitoring 알림 설정
이 섹션에서는 Monitoring에서 개별 측정항목에 대한 알림을 설정하는 방법을 설명합니다.
측정항목에 대한 알림을 만들려면 다음 안내를 따르세요.
Google Cloud 콘솔에서 Monitoring을 선택하거나 다음 버튼을 사용합니다.
왼쪽 탐색 메뉴에서 알림을 클릭합니다.
정책 만들기 버튼을 클릭합니다.
정책 이름을 입력합니다.
조건 추가를 클릭합니다.
- 조건 이름(예: '메모리 사용량 알림')을 입력합니다.
- 대상 아래에서 Memorystore Memcached Node 인스턴스 리소스 유형을 선택합니다.
- 원하는 측정항목을 선택합니다. 예를 들어 '메모리 사용량'을 선택합니다.
- 구성 아래에서 원하는 조건을 선택합니다.
- 예를 들어 메모리 사용량의 경우 시리즈가 위반할 때마다를 선택할 수 있습니다.
- 다음의 경우 조건 트리거, 기준, 지속 기간(기간 라벨)에서 값을 선택합니다.
- 예를 들어 조건을 초과하고 기준을 인스턴스 크기의 80%에 해당하는 바이트 수로 설정합니다. 처음에는 기간을 1분으로 설정하여 사용 패턴을 파악합니다.
- 추가를 클릭합니다.
알림 채널을 설정합니다.
- 알림 채널 추가 버튼을 클릭합니다.
- 옵션 1) 알림 채널 유형 메뉴에서 이메일을 선택합니다.
- 알림을 보낼 이메일 주소를 입력합니다.
- 옵션 2) 다른 유형의 알림 채널 설정에 대한 안내는 채널 만들기를 참조하세요.
- 옵션 1) 알림 채널 유형 메뉴에서 이메일을 선택합니다.
- 알림 채널 추가 버튼을 클릭합니다.
저장 버튼을 클릭합니다.
Memcached 로그보기
Memcached는 Cloud Logging이 캡처하는 로그를 생성합니다.
감사 로그 보기
Google Cloud 콘솔에서 로그 탐색기 페이지로 이동합니다.
감사 로그를 보려면 리소스 드롭다운에서 감사를 받은 리소스 > memcached.googleapis.com을 선택합니다.
다음 단계
- 사용할 수 있는 Memcached 측정항목보기
- 사용할 수 있는 Memcached 구성보기