This document describes how to use the Logs Dashboard page to detect trends in the behavior of your systems, monitor your workloads, and diagnose and resolve problems by using the predefined dashboard or by creating a custom dashboard.
Types of dashboards
The Logs Dashboard page has two options for visualizing the performance of the resources in your Google Cloud project: the predefined dashboard and a custom dashboard. The predefined dashboard is always available and is managed by Monitoring, but you can also customize this predefined dashboard.
Predefined dashboard
The predefined dashboard is automatically configured and only provides information for resources in your Google Cloud project that are producing logs data.
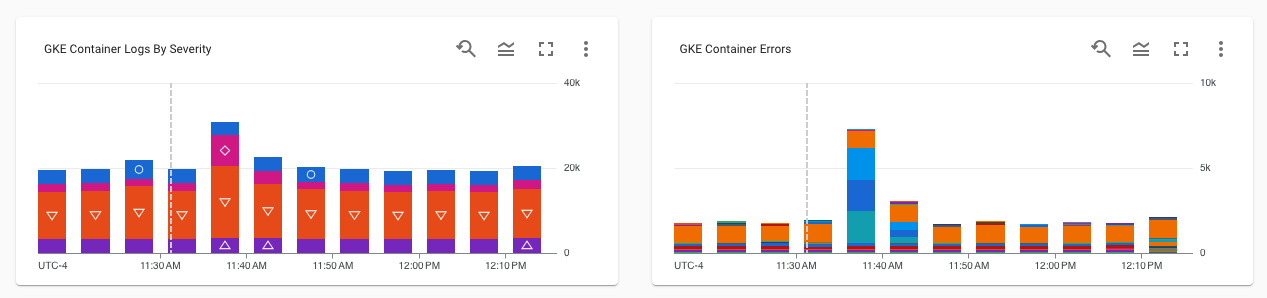
The predefined dashboard is organized into a pair of charts for each of the following resource types:
Google Kubernetes Engine
Compute Engine
App Engine
Cloud Load Balancing
Cloud SQL
BigQuery
One chart displays the number of logs and their severity types, such as
WARNING. The other chart displays logs that contain errors. To get more
information about severity types or error logs, hold your pointer over the
chart.
The following screenshot is an example of the predefined dashboard:
Custom dashboard
If the content in the predefined dashboard doesn't contain the information you need to help you troubleshoot, then consider creating a custom dashboard. Custom dashboards let you display information that is of interest to you, organized in a way that's useful to you. For example, you might create a dashboard that displays the logs, metrics, and alerting policies for virtual machines (VM) in your production environment.
Custom dashboards are managed by Cloud Monitoring, but you must create a new custom dashboard to use in the Logs Dashboard page. The custom dashboard you create in the Logs Dashboard page is only accessible in Cloud Logging. When you create a custom dashboard, the predefined dashboard is copied into the custom dashboard, so that you can delete unnecessary widgets and add missing content.
View the predefined dashboard
To view the predefined dashboard, do the following:
-
In the Google Cloud console, go to the Logs Dashboard page:
If you use the search bar to find this page, then select the result whose subheading is Monitoring.
If the Dashboard menu is enabled, then select Predefined.
Customize the predefined dashboard
You can't modify the predefined dashboard. However, you can make a copy of this dashboard, and then modify the copy.
To create a copy of the predefined dashboard, do the following:
-
In the Google Cloud console, go to the Logs Dashboard page:
If you use the search bar to find this page, then select the result whose subheading is Monitoring.
- In the toolbar of the dashboard, select editCustomize Dashboard.
A dashboard is created and displayed. The name of the dashboard is listed in the Custom view name text box. The toolbar also displays three buttons: Add widget, Exit Edit Mode, and Save.
Modify the dashboard by adding or removing widgets, by editing existing widgets, or by moving widgets.
For example, to add a widget, click Add widget, complete the dialog, and then select Apply. For more information about adding widgets, see the following pages:
After you complete your modifications, go to the toobar and click Save.
To toggle between the predefined dashboard and your custom dashboard, use the menu in the toolbar.
What's next
For information about dashboards and how to select what information to display on a dashboard, see Dashboards overview.
For information about displaying project-scoped logs on your dashboards, see Display logs on a custom dashboard.