本文档介绍了如何使用Google Cloud 控制台列出基于日志的指标并绘制其图表。如需了解如何创建基于日志的指标,请参阅配置计数器指标和配置分布指标。
准备工作
确保您的 Identity and Access Management 角色包含创建和查看基于日志的指标以及创建提醒政策所需的权限。如需了解详情,请参阅基于日志的指标的权限。
列出基于日志的指标
如需查看 Google Cloud 项目的基于日志的指标列表,请执行以下操作:
-
在 Google Cloud 控制台中,前往基于日志的指标页面:
如果您使用搜索栏查找此页面,请选择子标题为 Logging 的结果。
选择现有 Google Cloud 项目。基于日志的指标界面显示两个指标类型列表:系统指标和用户定义的指标。
基于日志的指标界面的用户定义的指标窗格有几个功能,可帮助您管理Google Cloud 项目中用户定义的指标:
“用户定义的指标”表包括名称、说明、类型和过滤条件列。这些字段在您创建指标时指定。
借助过滤用户定义的指标窗格,您可以通过文本搜索或指标名称、说明和过滤条件来过滤您的指标列表:
“用户定义的指标”表包括上月使用量列和月初至今的用量 (MTD) 列。例如,如果您想要确定哪些指标注入了最多的数据量或是想要估算账单,这种使用情况数据会非常实用。
在您的用户定义的指标窗格中,每个指标的 more_vert 更多菜单都包含用于管理指标的附加功能:
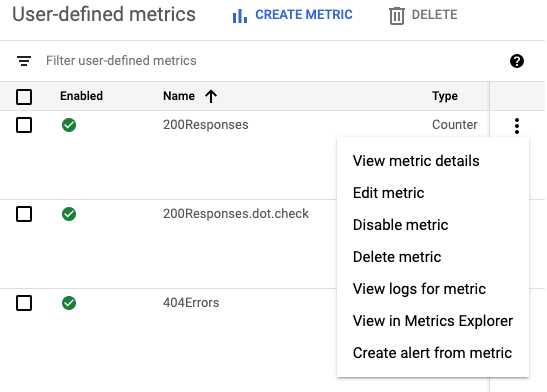
- 查看指标详情:显示指标的名称、类型、描述、过滤条件、单位和标签。
- 修改指标:允许您修改该指标的某些字段。
- 停用指标:允许您停止计算该指标。 您可以通过同一菜单重新启用已停用的指标。
- 删除指标:允许您删除指标。
- 查看指标的日志:将您转到 Logs Explorer,并在查询构建器中填充该指标的过滤条件,然后运行查询。
- 在 Metrics Explorer 中查看:可用于绘制指标图表。
- 根据指标创建提醒:可让您配置通知,以便在基于日志的指标符合您指定的条件时发出。如需了解详情,请参阅基于日志的指标的提醒。
绘制基于日志的指标图表
如需创建基于日志的指标图表,请执行以下操作:
-
在 Google Cloud 控制台中,前往基于日志的指标页面:
如果您使用搜索栏查找此页面,请选择子标题为 Logging 的结果。
找到要查看的指标,然后在指标的 more_vert 更多菜单中选择在 Metrics Explorer 中查看。
Metrics Explorer 会打开并为您预先配置。不过,您可能需要更改一些图表设置。
例如,以下屏幕截图显示了特定 Google Cloud 项目的名为
byte_count的系统指标的图表: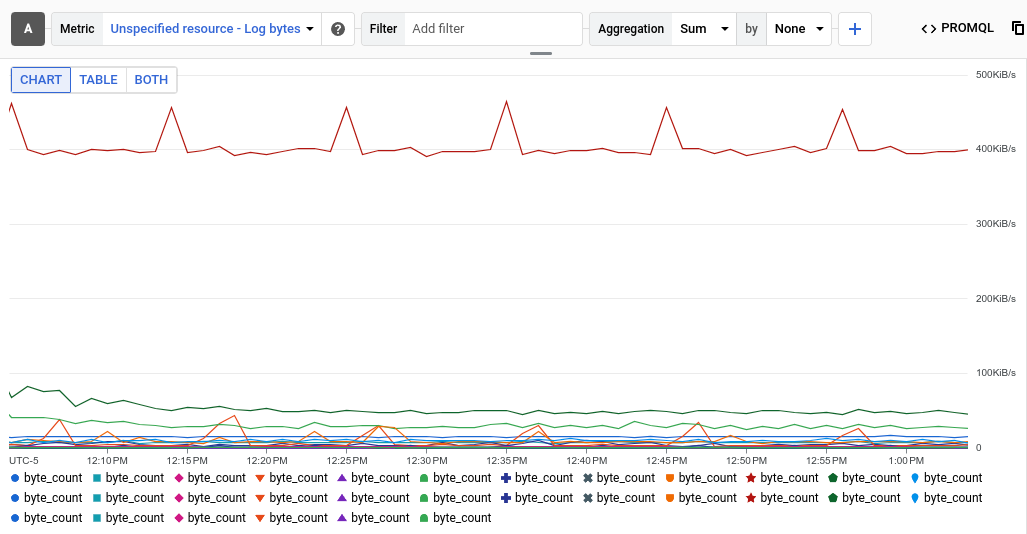
汇总条目显示图表中的每个时序是写入特定日志的字节总和。在上一个示例中,项目包含多条日志,因此图表会显示多个时序。
如需查看特定日志的数据,请添加过滤条件。例如,如需查看由 BigQuery 写入的日志条目的
byte_count指标,请点击添加过滤条件,选择 log,然后选择 BigQuery 条目。该图表现在显示单个时序,其中显示了 BigQuery 写入的日志字节总数。如果您想按日志条目的严重程度查看byte_count指标,请将汇总条目中的第二个菜单从无更改为严重程度。下图按 BigQuery 写入的日志的严重级别显示了byte_count指标: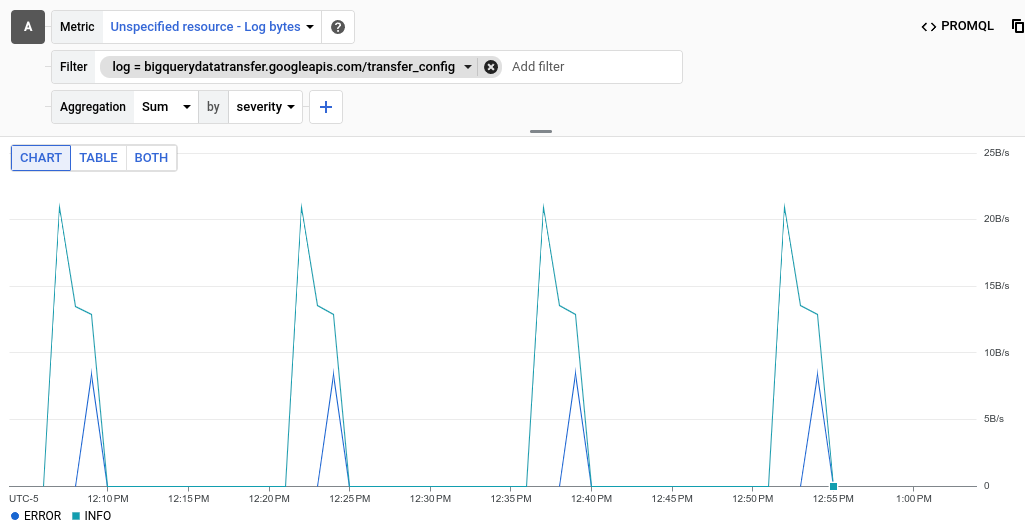
对于分布值基于日志的指标,请展开折线图,然后选择热图。
可选:如需保存图表以供日后参考,请点击工具栏中的保存图表,然后完成对话框。您可以将图表保存到现有信息中心,也可以创建新信息中心。
后续步骤
- 如需为基于日志的指标创建提醒政策,请参阅基于日志的指标的提醒。
如需详细了解如何绘制指标数据图表,请参阅以下 Monitoring 资源: