이 문서에서는Google Cloud 콘솔을 사용하여 로그 기반 측정항목을 나열하고 차트로 작성하는 방법을 설명합니다. 로그 기반 측정항목을 만드는 방법은 카운터 측정항목 구성과 분포 측정항목 구성을 참조하세요.
시작하기 전에
Identity and Access Management 역할에 로그 기반 측정항목을 만들고 보고 알림 정책을 만드는 데 필요한 권한이 포함되어 있는지 확인하세요. 자세한 내용은 로그 기반 측정항목에 대한 권한을 참조하세요.
로그 기반 측정항목 나열
Google Cloud 프로젝트의 로그 기반 측정항목 목록을 보려면 다음을 수행합니다.
-
Google Cloud 콘솔에서 로그 기반 측정항목 페이지로 이동합니다.
검색창을 사용하여 이 페이지를 찾은 경우 부제목이 Logging인 결과를 선택합니다.
기존 Google Cloud 프로젝트 선택 로그 기반 측정항목 인터페이스는 시스템 측정항목과 사용자 정의 측정항목이라는 두 가지 측정항목 유형 목록을 표시합니다.
로그 기반 측정항목 인터페이스의 사용자 정의 측정항목 창에는Google Cloud 프로젝트에서 사용자 정의 측정항목을 관리하는 데 도움이 되는 몇 가지 기능이 있습니다.
사용자 정의 측정항목 표에는 이름, 설명, 유형, 필터 열이 있습니다. 이러한 필드는 측정항목을 만들 때 지정됩니다.
필터 사용자 정의 측정항목 창에서는 텍스트 검색 또는 측정항목 이름, 설명, 필터를 기준으로 측정항목 목록을 필터링할 수 있습니다.
사용자 정의 측정항목 표에는 지난달 사용량 및 월간 누적 사용량(이번 달 누적) 열이 있습니다. 예를 들어 가장 많은 데이터를 수집하는 측정항목을 확인하거나 청구 비용을 추산하려는 경우 이 사용량 데이터가 유용합니다.
사용자 정의 측정항목 창의 각 측정항목에 대한 more_vert 더보기 메뉴에는 측정항목 관리를 위한 추가 기능이 포함되어 있습니다.
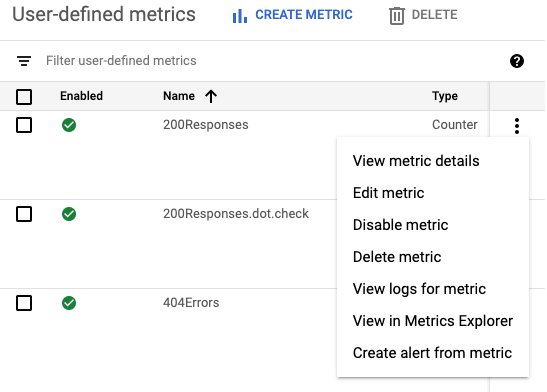
- 측정항목 세부정보 보기: 측정항목의 이름, 유형, 설명, 필터, 단위, 라벨(정의된 경우)을 표시합니다.
- 측정항목 수정: 측정항목의 특정 필드를 수정할 수 있습니다.
- 측정항목 사용 중지: 측정항목 계산을 중지할 수 있습니다. 동일한 메뉴에서 사용 중지된 측정항목을 다시 사용 설정할 수 있습니다.
- 측정항목 삭제: 측정항목을 삭제할 수 있습니다.
- 측정항목 로그 보기: 로그 탐색기로 이동하여 쿼리 빌더에서 측정항목의 필터를 채우고 쿼리를 실행합니다.
- 측정항목 탐색기에서 보기: 측정항목을 차트로 작성할 수 있습니다.
- 측정항목에서 알림 생성: 로그 기반 측정항목이 지정한 기준과 일치할 때의 알림을 구성할 수 있습니다. 자세한 내용은 로그 기반 측정항목에 대한 알림을 참조하세요.
로그 기반 측정항목 차트 작성
로그 기반 측정항목의 차트를 만들려면 다음을 수행합니다.
-
Google Cloud 콘솔에서 로그 기반 측정항목 페이지로 이동합니다.
검색창을 사용하여 이 페이지를 찾은 경우 부제목이 Logging인 결과를 선택합니다.
보려는 측정항목을 찾은 후 측정항목의 more_vert 더보기 메뉴에서 측정항목 탐색기에서 보기를 클릭합니다.
측정항목 탐색기가 열리고 사전 구성되어 있습니다. 하지만 일부 차트 설정을 변경할 수 있습니다.
예를 들어 다음 스크린샷에서는 특정 Google Cloud 프로젝트의 이름이
byte_count인 시스템 측정항목 차트를 보여줍니다.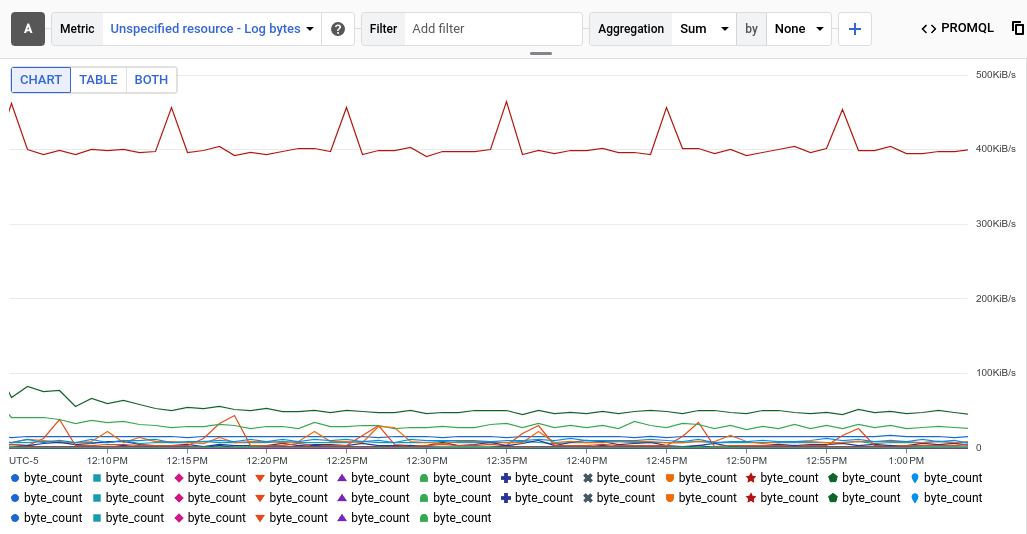
집계 항목에서는 차트의 각 시계열이 특정 로그에 기록된 바이트의 합계임을 보여줍니다. 이전 예시에서는 프로젝트에 로그 여러 개가 포함되어 있으므로 차트에 시계열 여러 개가 표시됩니다.
특정 로그의 데이터를 보려면 필터를 추가합니다. 예를 들어 BigQuery에서 작성한 로그 항목의
byte_count측정항목을 보려면 필터 추가를 클릭하고 로그를 선택한 후 BigQuery 항목을 선택합니다. 이제 차트에 BigQuery가 작성한 로그 바이트의 합계를 보여주는 단일 시계열이 표시됩니다. 로그 항목의 심각도별로byte_count측정항목을 보려면 집계 항목의 두 번째 메뉴를 없음에서 심각도로 변경합니다. 다음 차트에서는 BigQuery에서 작성한 로그의 심각도 수준별로 표시된byte_count측정항목을 보여줍니다.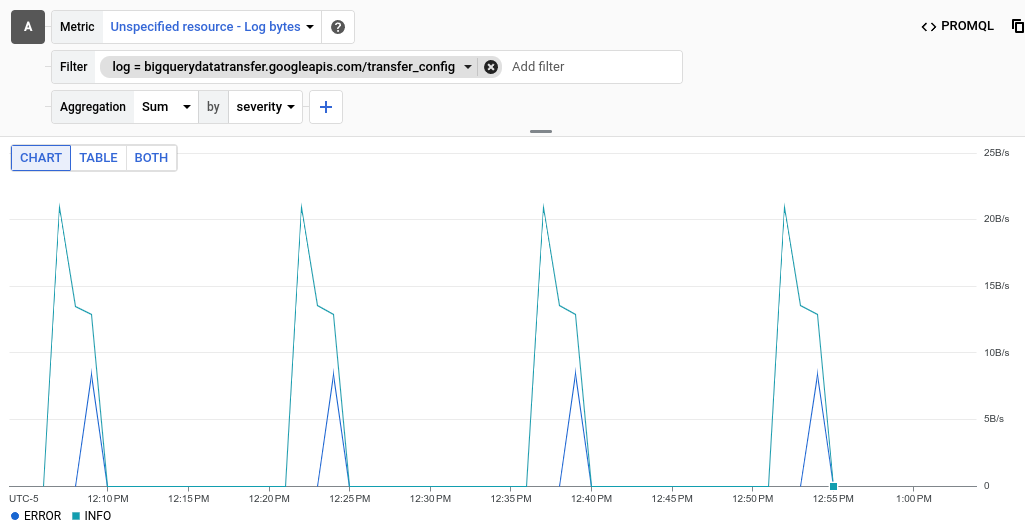
분포 값 로그 기반 측정항목의 경우 선 차트를 펼치고 히트맵 차트를 선택합니다.
분포 값 측정항목에 대한 자세한 내용은 분포 측정항목 및 백분위수 및 분포 값 측정항목을 참조하세요.
선택사항: 나중에 참조할 수 있도록 차트를 저장하려면 툴바에서 차트 저장을 클릭한 다음 대화상자를 완료합니다. 차트를 기존 대시보드에 저장하거나 새 대시보드를 만들 수 있습니다.
다음 단계
- 로그 기반 측정항목에 대한 알림 정책을 만들려면 로그 기반 측정항목에 대한 알림을 참조하세요.
측정항목 데이터를 차트로 작성하는 방법에 대한 자세한 내용은 다음 모니터링 리소스를 참조하세요.