This document describes how to find, filter, and exclude log entries that are part of error groups when using the Logs Explorer. Error groups help you identify trends and recurring problems in your environment by grouping log entries that have errors by values such as exception type, frames, or messages.
Find error group details for a log entry
To track recurring errors across your application and to manage their resolution status, use the Error Reporting page of the Google Cloud console. The Error Reporting page lists error groups, including information about the specific type of error, the number of error occurrences, and the resolution status of each group.
Error Reporting automatically sets the value of the
error_groups ID field during the creation of an error group. The field
contains alphanumeric characters, - and _.
To query for a specific error group, do the following:
-
In the Google Cloud console, go to the Error Reporting page:
You can also find this page by using the search bar.
- Click the error name.
- In the Recent samples panel, click View Logs from any log entry to redirect you to the Logs Explorer page.
In the Logs Explorer, the query-editor field is populated with the
error_groupsID field. For example,errorGroups.id="CJqhkd7Qvsbj2QE".The list of log entries contributing to that error group is shown in the Query results pane.
To query for log entries that belong to any error group and to find the error group details, do the following:
-
In the Google Cloud console, go to the Logs Explorer page:
If you use the search bar to find this page, then select the result whose subheading is Logging.
To view log entries associated with any error group, enter the following filter into the query-editor field:
errorGroups.id:*In the Query results pane, select a log entry that displays the
 Error group button.
Click the
Error group button and
select View error group details:For example, the following screenshot shows two log entries with a severity level of at least error. One of these entries is annotated with the
Error group button. The following screenshot also illustrates the
options available with this button: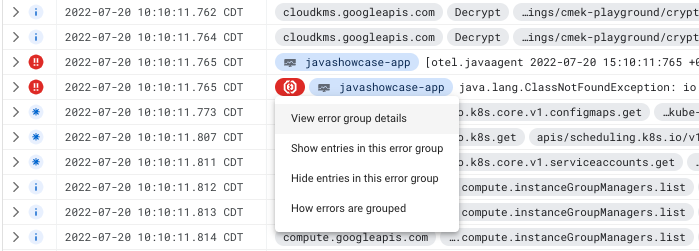
After you select View error group details, the Error reporting page opens and displays information about the error group.
You can also use the options in the
Error group button to change which log entries the Logs Explorer
displays:
To investigate the error group in more detail, select Show entries in this error group. Logs Explorer is refreshed and displays only those log entries in the same error group. You can now apply additional query parameters to the error group's log entries.
To remove a specific error group from your query results, select Hide entries in this error group. Logs Explorer is refreshed and all log entries in this error group are hidden from the display.
Monitor error groups
You can configure Error Reporting to notify you when it detects a new error group. This service also lets you view the history of errors for each error group and to manage those errors. For more information, see the following documents:
You can't create log-based metrics that count the number of log entries with
error groups or configure a log-based alert to notify you when a log entry
contains an error group. Similarly, you can't extract values from the
errorGroups field into a label attached to a log-based metric or
log-based alert.