本指南介绍了如何使用Google Cloud 控制台查看和过滤错误。您可以对错误进行过滤和排序,还可以查看有关错误的其他详细信息,并限制在特定时间范围内显示错误。
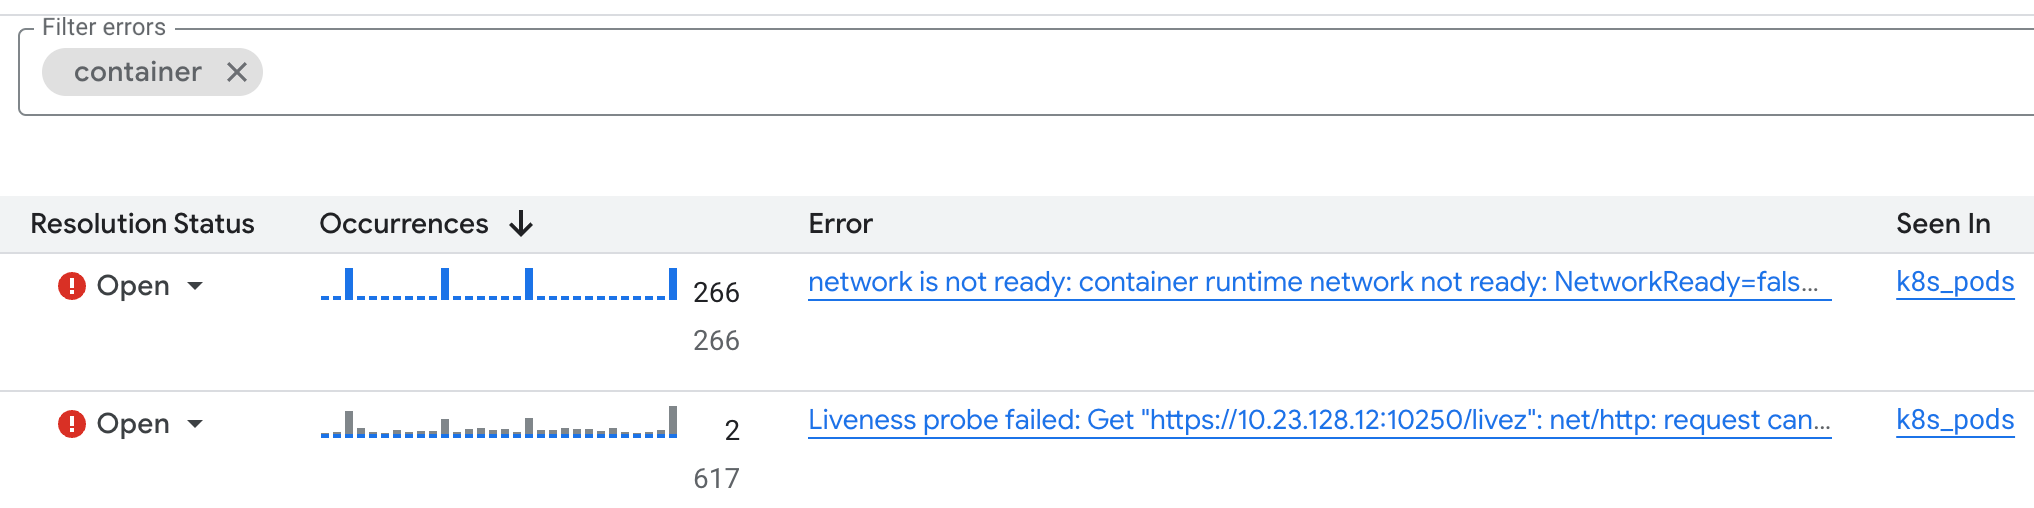
Error Reporting 页面会显示与当前过滤条件匹配的错误组列表。每行都会显示错误组的相关信息,例如解决状态、响应代码和错误名称。 出现次数列显示一个条形图,其中蓝色条形表示在所选时间范围内发生错误的次数。按文本过滤错误组时,条形图会显示灰色条,表示与文本过滤条件不匹配的错误数量:
如需了解 Error Reporting 如何将错误整理到错误组中,请参阅错误分组方式。
准备工作
- 确保您至少有一个错误组。如需了解详情,请参阅使用 Error Reporting 收集错误数据。
-
如需获得查看和过滤错误所需的权限,请让您的管理员为您授予项目的 Error Reporting Viewer (
roles/errorreporting.viewer) IAM 角色。 如需详细了解如何授予角色,请参阅管理对项目、文件夹和组织的访问权限。
查看错误详情
错误组的详细信息包括错误历史记录、解决状态、发生次数以及包含时间戳的错误列表。列表中的每个条目都包含指向相关日志的链接,以及堆栈轨迹(如有)。
如需查看错误组的详细信息,请执行以下操作:
-
在 Google Cloud 控制台中,前往 Error Reporting 页面:
您也可以使用搜索栏查找此页面。
点击相应错误名称。
错误组详情页面会显示有关错误组的信息,包括错误的历史记录、特定错误实例以及错误样本中的诊断信息。如果项目中已启用 Gemini,您可以使用 Gemini 获取问题排查建议。
查看关联的日志条目
如需查看与某个样本错误相关联的日志条目,请在最近的示例面板中点击任意条目中的查看日志。系统随即会转到日志浏览器页面。
在 Logs Explorer 中,查询编辑器窗格会预先填充包含 error_groups ID 字段的过滤条件。属于该错误组的日志条目列表会显示在查询结果窗格中。
如果日志条目属于某个错误组,Logs Explorer 会在日志条目的显示中添加错误组按钮 ( )。点击该按钮可访问分组详细信息,或更改显示的日志条目。如需了解详情,请参阅查找包含错误组的日志条目。
如需详细了解如何使用 Google Cloud 控制台查看这些日志,请参阅使用日志浏览器。
过滤错误组
您可以使用 Error Reporting”工具栏上的过滤条件,按状态、受影响的资源以及存储日志条目的日志存储分区的区域进行过滤。
按资源过滤错误组
如需按资源过滤错误组,请选择所有资源菜单,然后选择一个资源。某些资源允许您按错误组标签进一步过滤。 可用的错误组标签的类型和数量因资源而异。例如,如果您有 Kubernetes Container Services 资源对应的错误组,则可以先按服务过滤,然后再按版本过滤:

如需保存所选内容,请点击应用。
如需清除资源过滤条件并重置过滤后的错误组列表,请依次选择重置和应用。
按文本过滤错误组
如需按文本过滤错误,请在过滤错误文本字段中输入一个值。 文本过滤条件可以对以下任一字段执行文本匹配:
- 错误信息
- HTTP 响应代码
- 异常堆栈
- 请求网址
- 报告位置
- HTTP 方法