Để truy cập vào trang tổng quan, trong bảng điều khiển Google Cloud , hãy chuyển đến trang
Trang tổng quan.
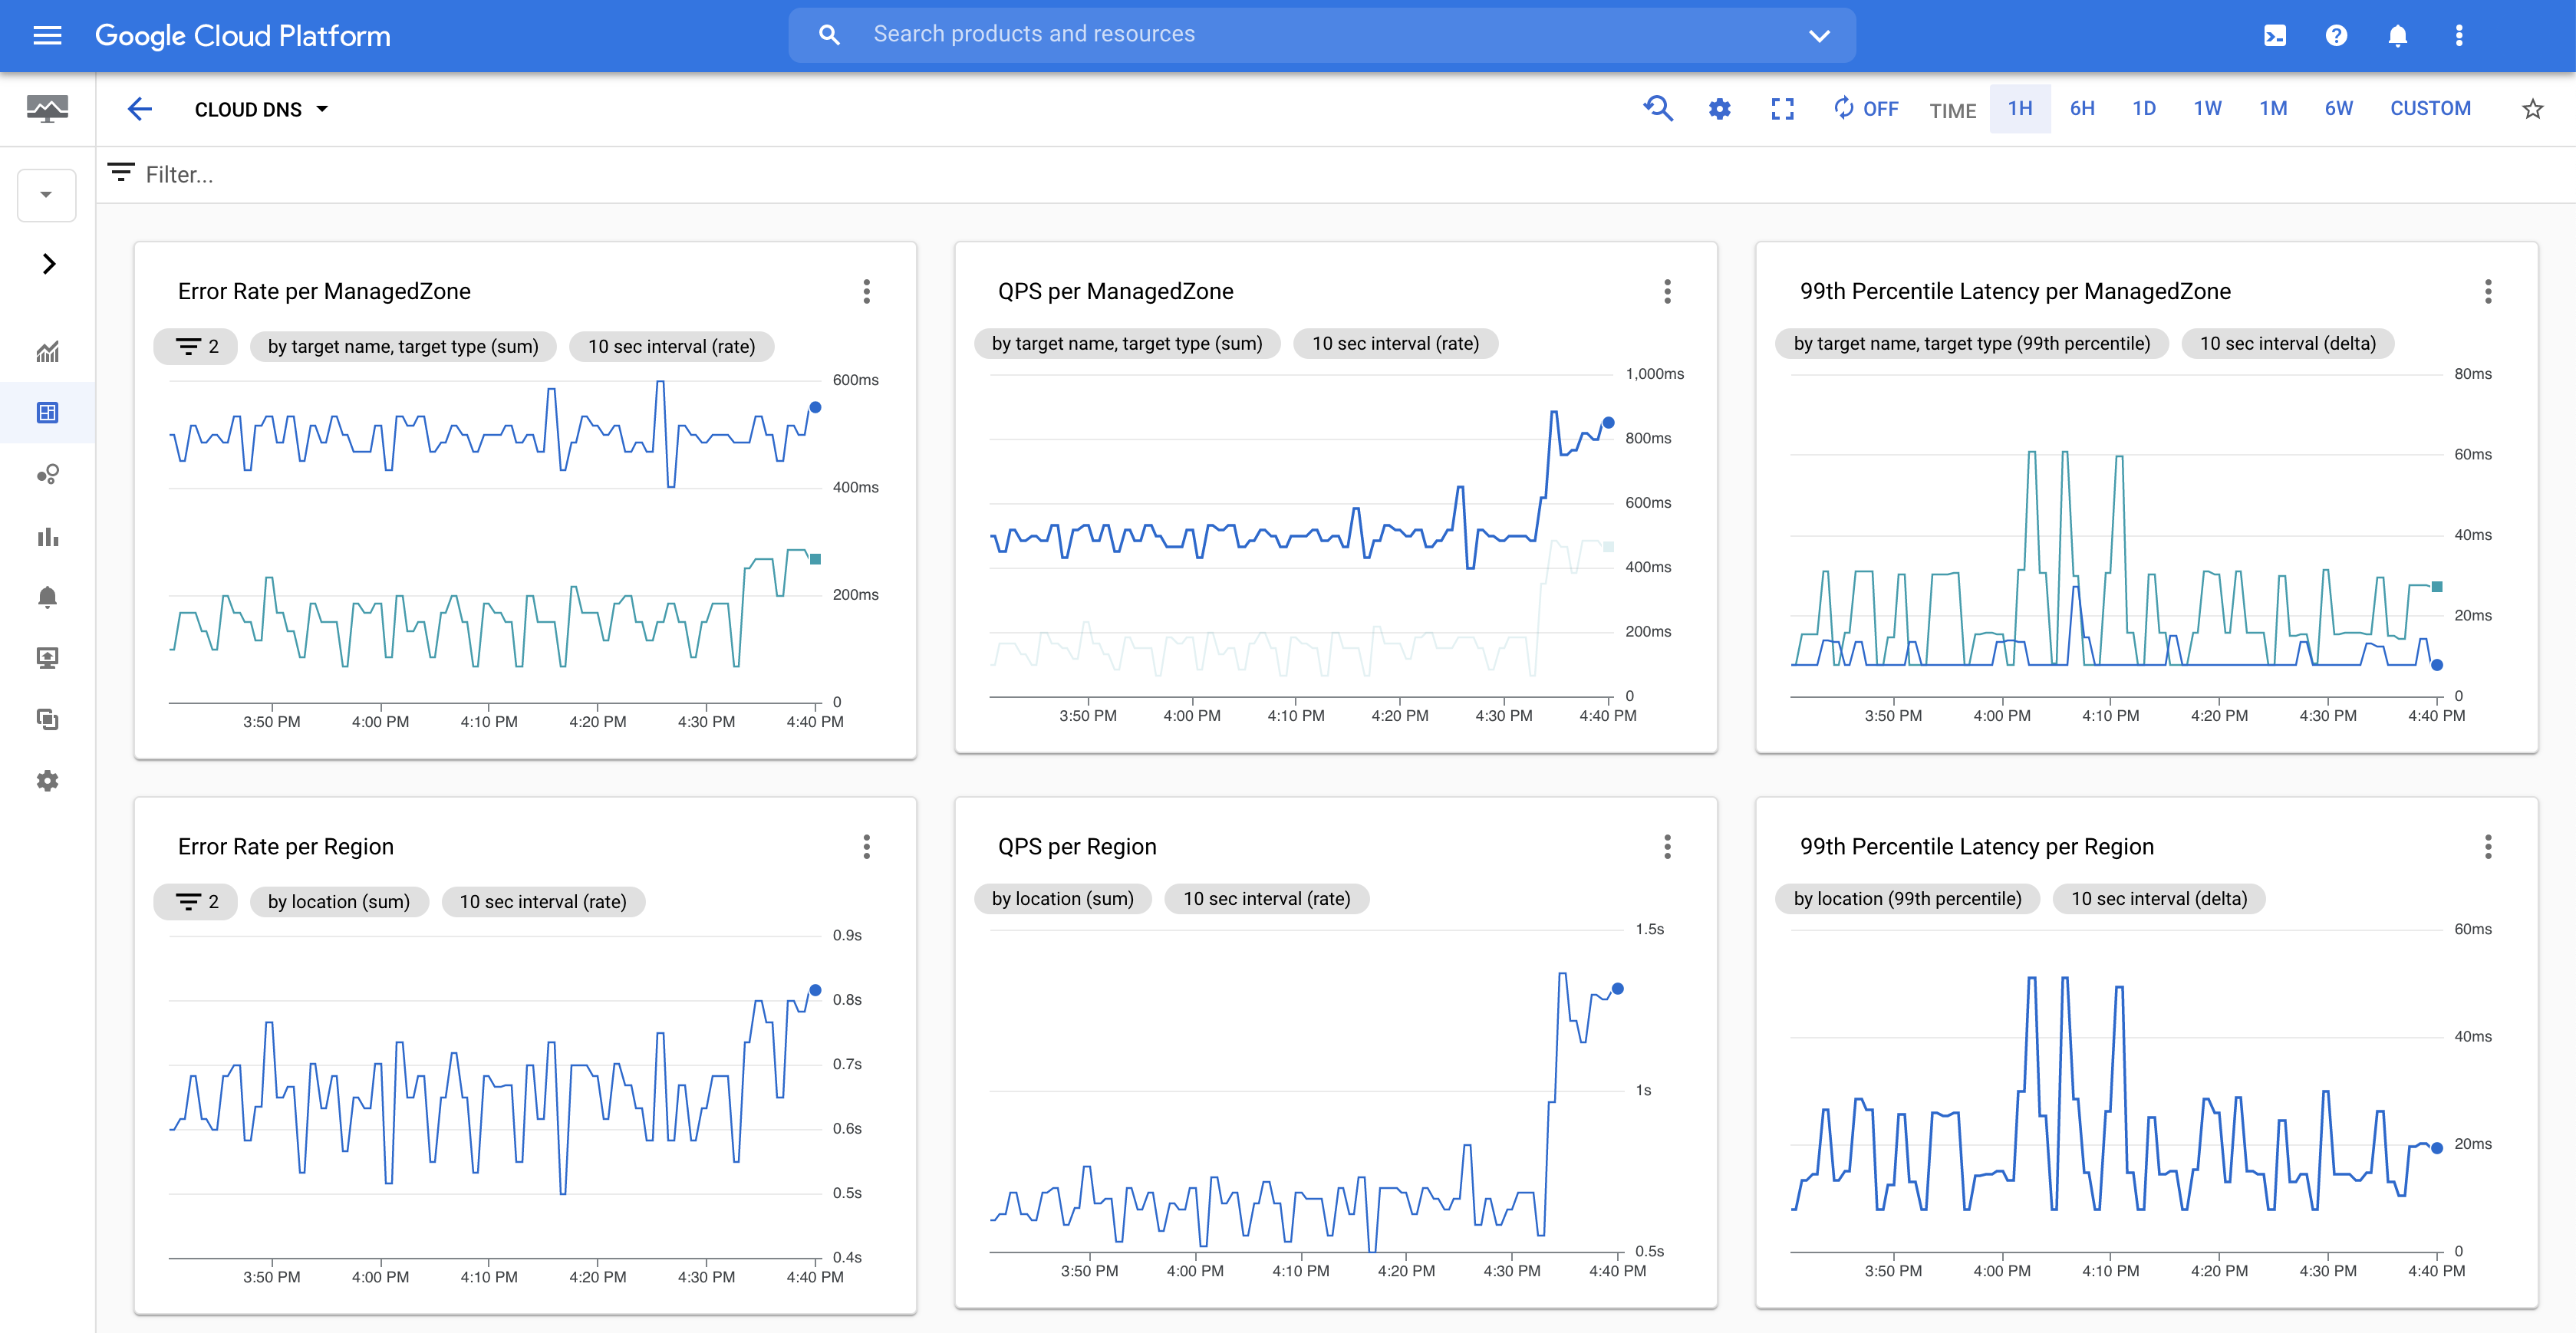
Trang tổng quan về việc giám sát DNS trên đám mây (nhấp để phóng to)
Trang tổng quan về hoạt động giám sát Cloud DNS cho phép bạn xem biểu đồ về các truy vấn DNS, đồng thời hiển thị dữ liệu về tỷ lệ lỗi, QPS và độ trễ ở phân vị thứ 99.
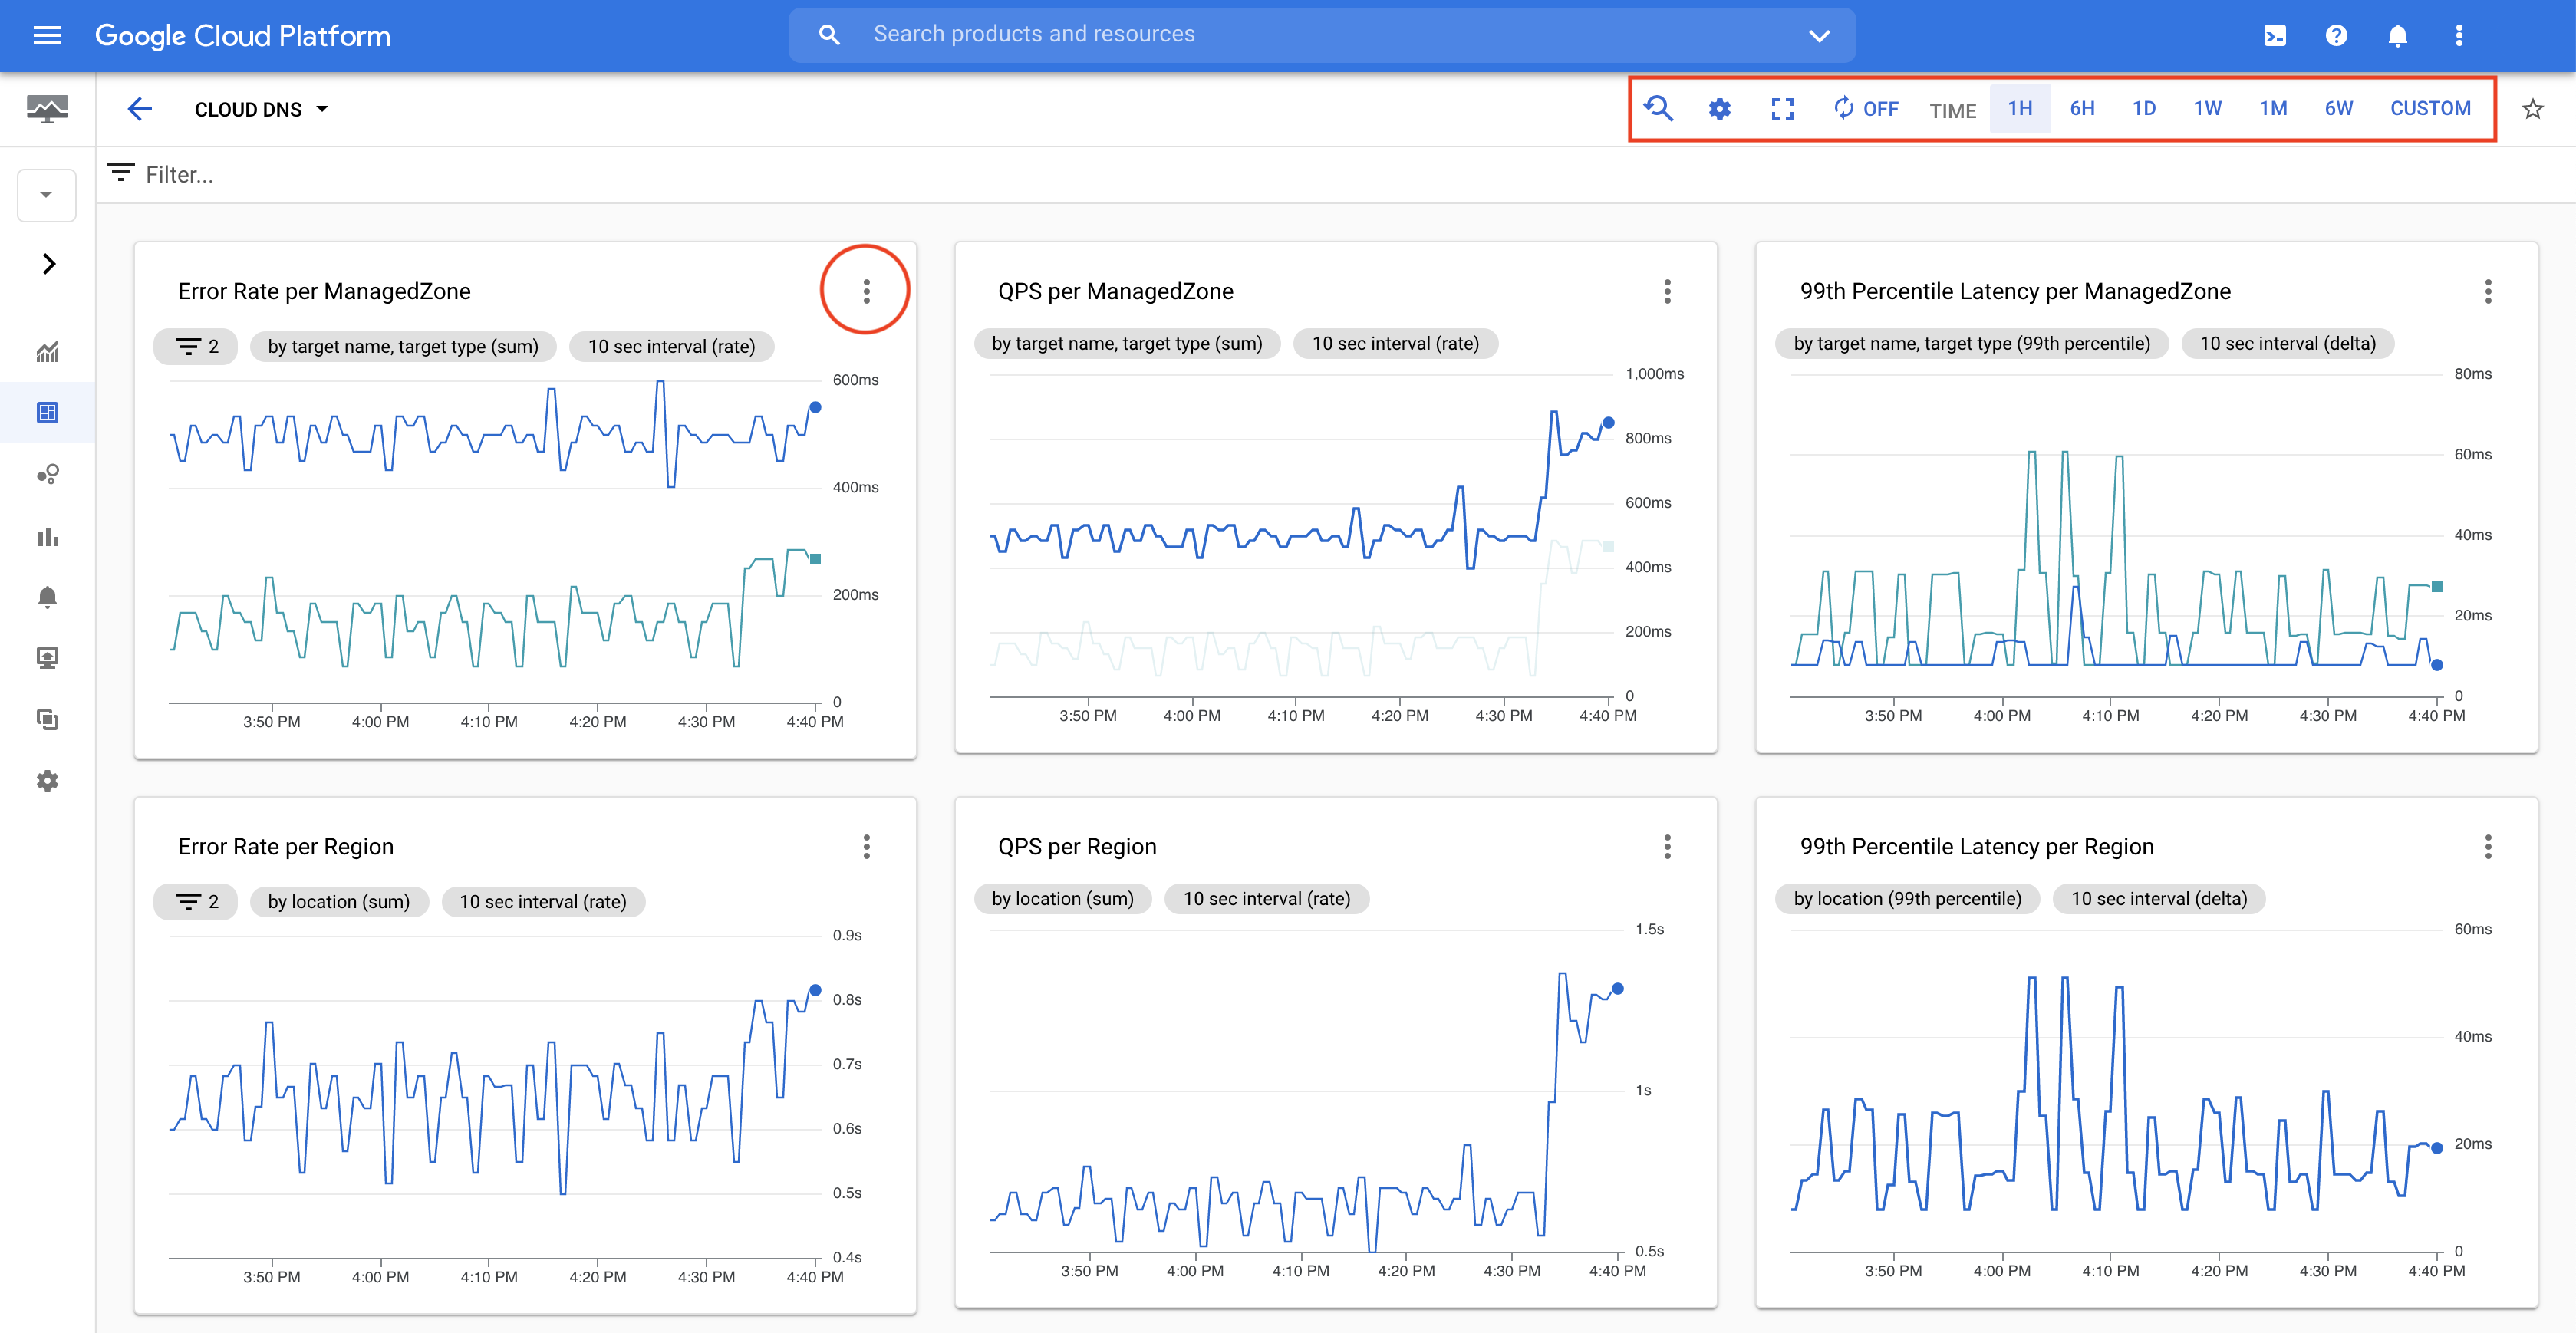
Trang giám sát cho phép bạn chọn cách hiển thị dữ liệu.
trang theo dõi bảng điều khiểnGoogle Cloud (nhấp để phóng to)
Để thực hiện những thao tác sau (và nhiều thao tác khác), hãy nhấp vào biểu tượng more_vertTrình đơn ở trên cùng bên phải của một biểu đồ riêng lẻ:
Xem trong Trình khám phá chỉ số. Thao tác này cho phép bạn mở biểu đồ trong Trình khám phá chỉ số để chỉnh sửa các tham số đầu vào nếu cần và thử nghiệm với dữ liệu.
Việc này không làm thay đổi nội dung của biểu đồ trong trang tổng quan thực tế.
Mở rộng chú giải biểu đồ. Thao tác này cho phép bạn xem chú giải mô tả từng dòng trên biểu đồ.
Chế độ xem số liệu thống kê. Thao tác này cho phép bạn xem một biểu đồ có nhiều dòng hơn cho thấy thêm thông tin thống kê về dữ liệu. Ví dụ: trong biểu đồ Độ trễ theo percentile thứ 99, giá trị trung bình, trung vị và percentile thứ 5 cũng được hiển thị.
Trong trình đơn ở trên cùng bên phải của trang, bạn có thể điều chỉnh tiến trình của biểu đồ.
[[["Dễ hiểu","easyToUnderstand","thumb-up"],["Giúp tôi giải quyết được vấn đề","solvedMyProblem","thumb-up"],["Khác","otherUp","thumb-up"]],[["Khó hiểu","hardToUnderstand","thumb-down"],["Thông tin hoặc mã mẫu không chính xác","incorrectInformationOrSampleCode","thumb-down"],["Thiếu thông tin/mẫu tôi cần","missingTheInformationSamplesINeed","thumb-down"],["Vấn đề về bản dịch","translationIssue","thumb-down"],["Khác","otherDown","thumb-down"]],["Cập nhật lần gần đây nhất: 2025-06-27 UTC."],[[["\u003cp\u003eThis page provides information on the Cloud DNS predefined monitoring dashboard, accessible via the Google Cloud console.\u003c/p\u003e\n"],["\u003cp\u003eThe dashboard displays charts for DNS queries, including error rate, queries per second (QPS), and 99th percentile latency.\u003c/p\u003e\n"],["\u003cp\u003eUsers can customize how data is displayed and adjust the timescale of the charts on the dashboard.\u003c/p\u003e\n"],["\u003cp\u003eThe dashboard allows for detailed chart analysis through the "Menu" options, including viewing in Metrics Explorer, expanding the legend, and viewing in Stats Mode.\u003c/p\u003e\n"]]],[],null,["# Use the Cloud DNS monitoring dashboard\n\nThis page provides information about Cloud DNS's [(private zone) predefined monitoring dashboard](/monitoring/charts/predefined-dashboards).\n\nTo access the dashboard, in the Google Cloud console, go to the\n[**Dashboards** page](https://console.cloud.google.com/monitoring/dashboards/resourceList/dns_query).\n[](/static/dns/images/dashboard.png) Cloud DNS monitoring dashboard (click to enlarge).\n\nThe Cloud DNS monitoring dashboard lets you view charts for DNS queries,\nand displays data for error rate, QPS, and 99th percentile latency.\n\nThe monitoring page lets you choose how the data is displayed.\n[](/static/dns/images/dashboard_marked.png) Google Cloud console monitoring page (click to enlarge).\n\nTo do the following (and more), click *more_vert* **Menu**\nat the top right of an individual chart:\n\n- **View in Metrics Explorer.** This lets you open the graph in [Metrics Explorer](/monitoring/charts/metrics-explorer) so that you can edit input parameters as needed and experiment with the data. This does not change the contents of the graph in the actual dashboard.\n- **Expand chart legend.** This lets you view a legend that describes each line on the graph.\n- **View Stats Mode.** This lets you view a chart with more lines that show additional statistics on the data. For example, in the 99th Percentile Latency charts, mean, median, and 5th percentile are also shown.\n\nIn the menu at the top right of the page, you can adjust the timescale of\nthe charts."]]