本文提供 Spark 指標的相關資訊。根據預設,Serverless for Apache Spark 會啟用可用的 Spark 指標收集功能,除非您使用 Spark 指標收集屬性停用或覆寫一或多個 Spark 指標的收集功能。
如要瞭解提交 Serverless for Apache Spark Spark 批次工作負載時可設定的其他屬性,請參閱「Spark 屬性」
Spark 指標收集屬性
您可以使用本節列出的屬性,停用或覆寫一或多個可用的 Spark 指標的收集作業。
| 屬性 | 說明 |
|---|---|
spark.dataproc.driver.metrics |
用於停用或覆寫 Spark 驅動程式指標。 |
spark.dataproc.executor.metrics |
用於停用或覆寫 Spark 執行器指標。 |
spark.dataproc.system.metrics |
用於停用 Spark 系統指標。 |
gcloud CLI 範例:
停用 Spark 驅動程式指標收集功能:
gcloud dataproc batches submit spark \
    --properties spark.dataproc.driver.metrics="" \
    --region=region \
    other args ...
覆寫 Spark 預設的驅動程式指標收集作業,只收集
BlockManager:disk.diskSpaceUsed_MB和DAGScheduler:stage.failedStages指標:gcloud dataproc batches submit spark \ --properties=^~^spark.dataproc.driver.metrics="BlockManager:disk.diskSpaceUsed_MB,DAGScheduler:stage.failedStages" \ --region=region \ other args ...
可用的 Spark 指標
除非您使用 Spark 指標收集屬性停用或覆寫收集作業,否則無伺服器 Apache Spark 會收集本節列出的 Spark 指標。
custom.googleapis.com/METRIC_EXPLORER_NAME。
Spark 驅動程式指標
| 指標 | Metrics Explorer 名稱 |
|---|---|
| BlockManager:disk.diskSpaceUsed_MB | spark/driver/BlockManager/disk/diskSpaceUsed_MB |
| BlockManager:memory.maxMem_MB | spark/driver/BlockManager/memory/maxMem_MB |
| BlockManager:memory.memUsed_MB | spark/driver/BlockManager/memory/memUsed_MB |
| DAGScheduler:job.activeJobs | spark/driver/DAGScheduler/job/activeJobs |
| DAGScheduler:job.allJobs | spark/driver/DAGScheduler/job/allJobs |
| DAGScheduler:messageProcessingTime | spark/driver/DAGScheduler/messageProcessingTime |
| DAGScheduler:stage.failedStages | spark/driver/DAGScheduler/stage/failedStages |
| DAGScheduler:stage.runningStages | spark/driver/DAGScheduler/stage/runningStages |
| DAGScheduler:stage.waitingStages | spark/driver/DAGScheduler/stage/waitingStages |
Spark 執行程式指標
| 指標 | Metrics Explorer 名稱 |
|---|---|
| ExecutorAllocationManager:executors.numberExecutorsDecommissionUnfinished | spark/driver/ExecutorAllocationManager/executors/numberExecutorsDecommissionUnfinished |
| ExecutorAllocationManager:executors.numberExecutorsExitedUnexpectedly | spark/driver/ExecutorAllocationManager/executors/numberExecutorsExitedUnexpectedly |
| ExecutorAllocationManager:executors.numberExecutorsGracefullyDecommissioned | spark/driver/ExecutorAllocationManager/executors/numberExecutorsGracefullyDecommissioned |
| ExecutorAllocationManager:executors.numberExecutorsKilledByDriver | spark/driver/ExecutorAllocationManager/executors/numberExecutorsKilledByDriver |
| LiveListenerBus:queue.executorManagement.listenerProcessingTime | spark/driver/LiveListenerBus/queue/executorManagement/listenerProcessingTime |
| executor:bytesRead | spark/executor/bytesRead |
| executor:bytesWritten | spark/executor/bytesWritten |
| executor:cpuTime | spark/executor/cpuTime |
| executor:diskBytesSpilled | spark/executor/diskBytesSpilled |
| executor:jvmGCTime | spark/executor/jvmGCTime |
| executor:memoryBytesSpilled | spark/executor/memoryBytesSpilled |
| executor:recordsRead | spark/executor/recordsRead |
| executor:recordsWritten | spark/executor/recordsWritten |
| executor:runTime | spark/executor/runTime |
| executor:shuffleFetchWaitTime | spark/executor/shuffleFetchWaitTime |
| executor:shuffleRecordsRead | spark/executor/shuffleRecordsRead |
| executor:shuffleRecordsWritten | spark/executor/shuffleRecordsWritten |
| executor:shuffleRemoteBytesReadToDisk | spark/executor/shuffleRemoteBytesReadToDisk |
| executor:shuffleWriteTime | spark/executor/shuffleWriteTime |
| executor:succeededTasks | spark/executor/succeededTasks |
| ExecutorMetrics:MajorGCTime | spark/executor/ExecutorMetrics/MajorGCTime |
| ExecutorMetrics:MinorGCTime | spark/executor/ExecutorMetrics/MinorGCTime |
系統指標
| 指標 | 指標探索工具名稱 |
|---|---|
| agent:uptime | agent/uptime |
| cpu:utilization | CPU/使用率 |
| disk:bytes_used | disk/bytes_used |
| disk:percent_used | disk/percent_used |
| memory:bytes_used | memory/bytes_used |
| memory:percent_used | memory/percent_used |
| network:tcp_connections | network/tcp_connections |
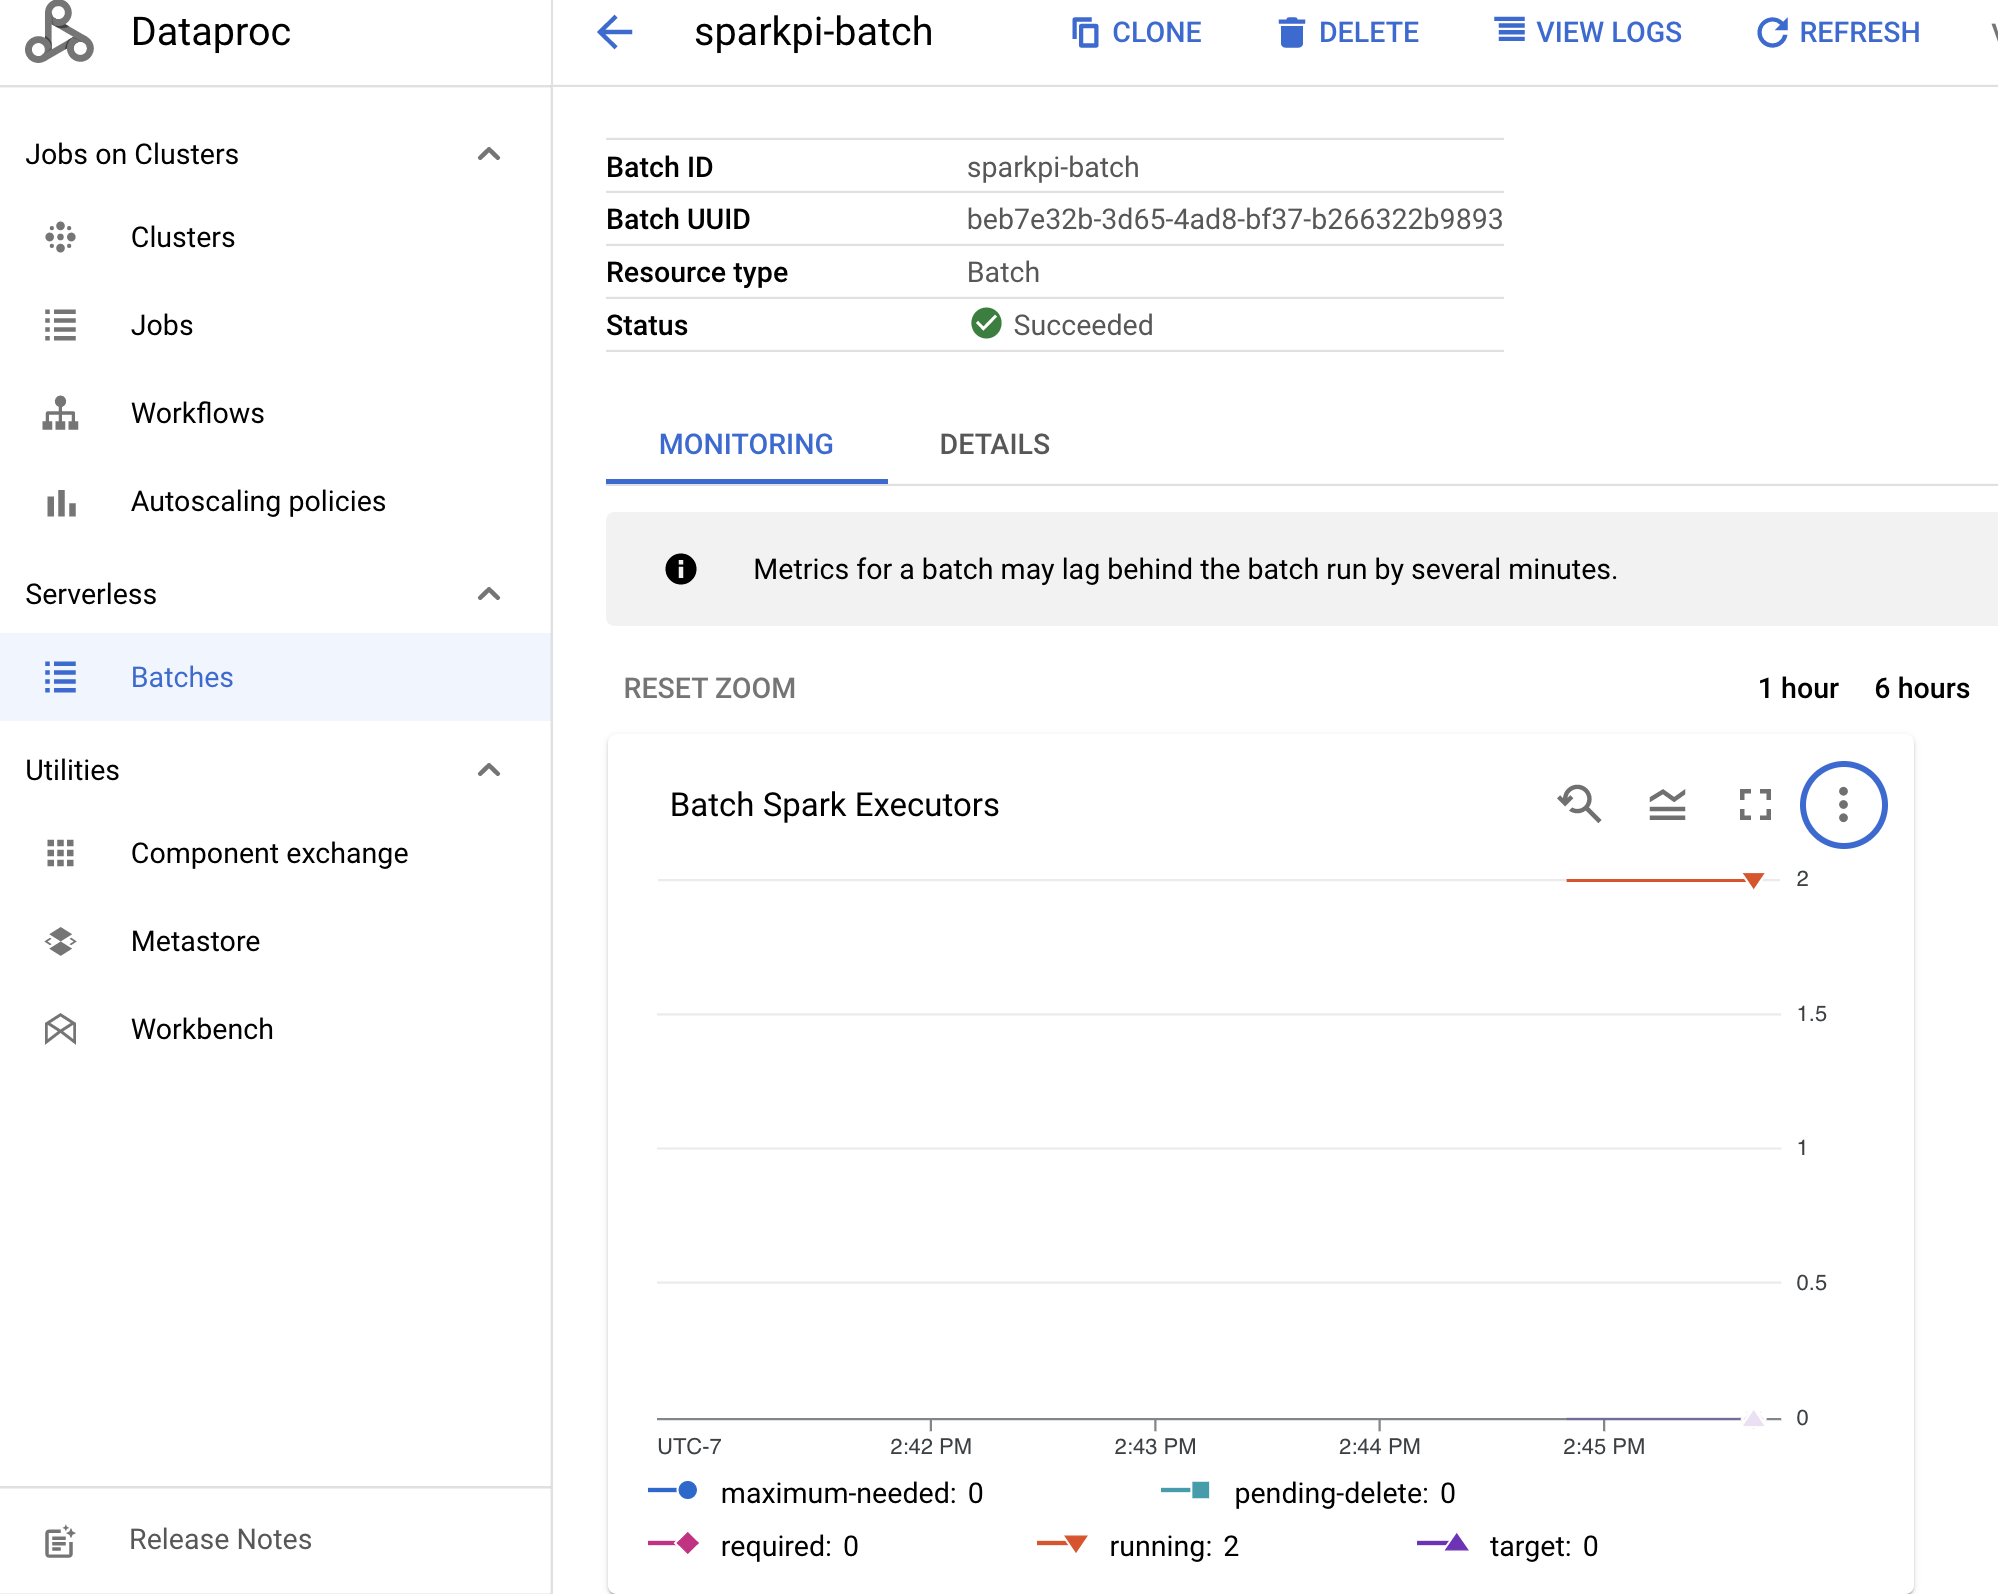
查看 Spark 指標
如要查看批次指標,請在Google Cloud 控制台的 Dataproc「批次」頁面上,按一下批次 ID 開啟批次「詳細資料」頁面,該頁面的「監控」分頁標籤下方會顯示批次工作負載的指標圖表。
如要進一步瞭解如何查看收集到的指標,請參閱 Dataproc Cloud Monitoring。