Google SecOps events schema
In BigQuery, the table called events stores UDM event records.
The hour_time_bucket field identifies the partition as the hour of day in the
metadata.event_timestamp UDM field. Values in the hour_time_bucket field
are hourly time stamps that take the form: <YYYY-MM-DD HH:MM:SS UTC>. Here are examples:
- 2022-05-20 00:00:00 UTC
- 2022-05-20 01:00:00 UTC
- 2022-05-20 02:00:00 UTC
- 2022-05-20 03:00:00 UTC
For example, the value 2022-05-20 00:00:00 UTC labels data with an event_timestamp between 2022-05-20 00:00:00 UTC and 2022-05-20 00:59:59 UTC. For more information, see Query partitioned tables.
The amount of time it takes for data to appear in the events table depends
on the difference between when the device records the event, the metadata.event_timestamp,
and when that event is ingested to Google Security Operations SIEM, the metadata.ingested_timestamp.
The following summarizes the time it takes for data to appear in the events table after it is received by Google Security Operations:
- If the difference is less than two hours, then data appears approximately 2 hours after it is ingested.
- If the difference is between 2 hours and 24 hours, it may take up to 4 hours for data to appear after it is ingested.
- If the difference is more than 24 hours, it may take up to 5 days for data to appear after it is ingested.
The events table schema changes regularly. To view information about the table,
including the current schema, see the BigQuery instructions for getting table information.
To access the events schema, do the following:
- Open the Google Cloud console, and then select the Google SecOps project ID that your Google SecOps representative provided shared with you.
Select BigQuery > BigQuery Studio > datalake > events.
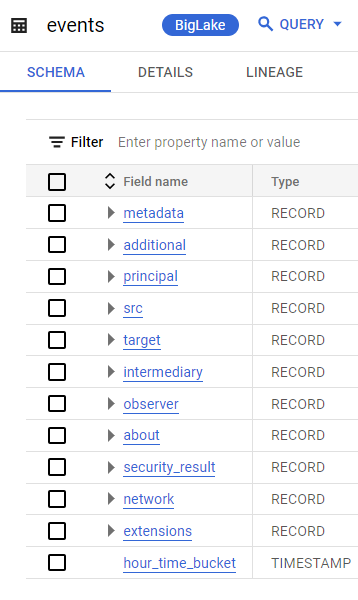
Figure:
eventstable in BigQuery
Events data model for dashboards
In Google SecOps embedded dashboards, you'll notice the data structure called UDM Events.
This is a Looker data model created for the events table in BigQuery.
The table includes the most commonly used UDM fields. It does not include all UDM fields. If there are missing UDM fields you need to have incorporated into a personalized dashboard, contact your Google SecOps representative.
To view fields in this Explore, perform the following steps:
- In the navigation bar, click Dashboards.
- Create a new dashboard (click Add > Create New) or edit an existing dashboard.
- Add a Tile.
- Select Visualization as the type if prompted.
- In the list of tables, select UDM Events.
Browse the list of fields.
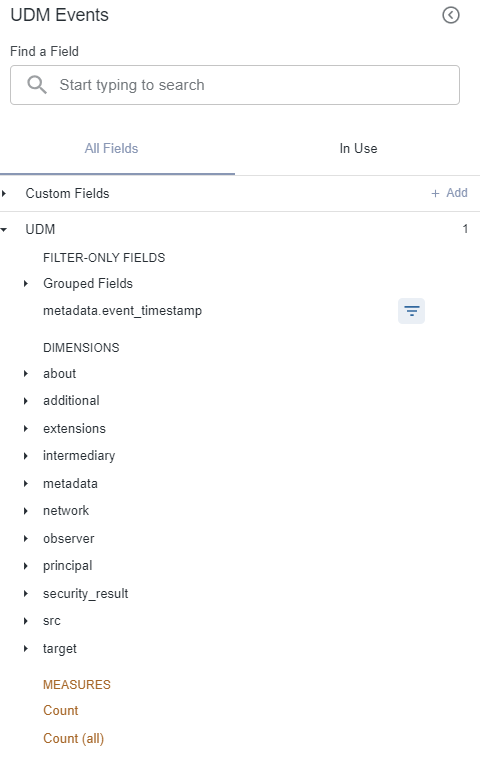
Figure: Field list in Google SecOps Events data model
What's next
- View a description of each UDM field in the Unified Data Model field list.
- For information about accessing and running queries in BigQuery, see Run interactive and batch query jobs.
- For information about how to query partitioned tables, see Query partitioned tables.
- For information about how to connect Looker to BigQuery, see Looker documentation about connecting to BigQuery.
- Information about how to query partitioned tables.