이 페이지에서는 사용자 애플리케이션의 커스텀 로그와 측정항목이 Cloud Logging 및 Cloud Monitoring과 Managed Service for Prometheus로 전송되도록 베어메탈용 Anthos 클러스터에 대해 클러스터를 구성하는 방법을 보여줍니다.
Managed Service for Prometheus 사용 설정
Managed Service for Prometheus 구성은 stackdriver라는 Stackdriver 객체에 지정됩니다. 권장사항 및 문제 해결에 대한 자세한 내용은 Managed Service for Prometheus 문서를 참조하세요.
Google Cloud Managed Service for Prometheus를 사용 설정하도록 stackdriver 객체를 구성하려면 다음 안내를 따르세요.
수정할 Stackdriver 객체를 엽니다.
kubectl --kubeconfig=CLUSTER_KUBECONFIG \ --namespace kube-system edit stackdriver stackdriverCLUSTER_KUBECONFIG를 클러스터 kubeconfig 파일의 경로로 바꿉니다.spec에서enableGMPForApplications를true로 설정합니다.apiVersion: addons.gke.io/v1alpha1 kind: Stackdriver metadata: name: stackdriver namespace: kube-system spec: projectID: ... clusterName: ... clusterLocation: ... proxyConfigSecretName: ... enableGMPForApplications: true enableVPC: ... optimizedMetrics: true수정한 파일을 저장하고 닫습니다.
Google 관리형 Prometheus 구성요소는
gmp-system네임스페이스의 클러스터에서 자동으로 시작됩니다.Google 관리형 Prometheus 구성요소를 확인합니다.
kubectl --kubeconfig=CLUSTER_KUBECONFIG --namespace gmp-system get pods이 명령어 결과는 다음과 비슷합니다.
NAME                              READY   STATUS    RESTARTS        AGE
collector-abcde                   2/2     Running   1 (5d18h ago)   5d18h
collector-fghij                   2/2     Running   1 (5d18h ago)   5d18h
collector-klmno                   2/2     Running   1 (5d18h ago)   5d18h
gmp-operator-68d49656fc-abcde     1/1     Running   0               5d18h
rule-evaluator-7c686485fc-fghij   2/2     Running   1 (5d18h ago)   5d18h
Managed Service for Prometheus는 규칙 평가 및 알림을 지원합니다. 규칙 평가를 설정하려면 규칙 평가를 참조하세요.
예시 애플리케이션 실행
관리형 서비스는 metrics 포트로 Prometheus 측정항목을 내보내는 예시 애플리케이션 prom-example의 매니페스트를 제공합니다. 이 애플리케이션에는 3개의 복제본이 사용됩니다.
애플리케이션을 배포하려면 다음 안내를 따르세요.
예시 애플리케이션의 일부로 만드는 리소스에 대해
gmp-testKubernetes 네임스페이스를 만듭니다.kubectl --kubeconfig=CLUSTER_KUBECONFIG create ns gmp-test다음 명령어로 애플리케이션 매니페스트를 적용합니다.
kubectl -n gmp-test apply \
    -f https://raw.githubusercontent.com/GoogleCloudPlatform/prometheus-engine/v0.4.1/examples/example-app.yaml
PodMonitoring 리소스 구성
이 섹션에서는 예시 애플리케이션에서 내보내고 Managed Service for Prometheus로 전송되는 측정항목 데이터를 캡처하도록 PodMonitoring 커스텀 리소스를 구성합니다. PodMonitoring 커스텀 리소스에는 대상 스크래핑이 사용됩니다. 이 경우 수집기 에이전트는 샘플 애플리케이션이 데이터를 내보내는 /metrics 엔드포인트를 스크래핑합니다.
PodMonitoring 커스텀 리소스는 배포된 네임스페이스에서만 대상을 스크래핑합니다. 여러 네임스페이스에서 대상을 스크래핑하려면 각 네임스페이스에 동일한 PodMonitoring 커스텀 리소스를 배포합니다. 다음 명령어를 실행하여 PodMonitoring 리소스가 의도한 네임스페이스에 설치되었는지 확인할 수 있습니다.
kubectl --kubeconfig CLUSTER_KUBECONFIG get podmonitoring -A
모든 Managed Service for Prometheus 커스텀 리소스에 대한 참조 문서는 prometheus-engine/doc/api 참조를 확인하세요.
다음 매니페스트는 gmp-test 네임스페이스에서 PodMonitoring 리소스 prom-example을 정의합니다. 리소스는 네임스페이스에서 값이 prom-example인 app 라벨이 있는 모든 포드를 찾습니다. 일치하는 포드는 /metrics HTTP 경로에서 30초 간격으로 metrics라는 포트로 스크래핑됩니다.
apiVersion: monitoring.googleapis.com/v1
kind: PodMonitoring
metadata:
  name: prom-example
spec:
  selector:
    matchLabels:
      app: prom-example
  endpoints:
  - port: metrics
    interval: 30s
이 리소스를 적용하려면 다음 명령어를 실행합니다.
kubectl --kubeconfig CLUSTER_KUBECONFIG -n gmp-test apply \
    -f https://raw.githubusercontent.com/GoogleCloudPlatform/prometheus-engine/v0.4.1/examples/pod-monitoring.yaml
이제 Prometheus용 관리형 서비스가 일치하는 포드를 스크래핑합니다.
측정항목 데이터 쿼리
Prometheus 데이터 내보내기가 수행되는지 확인하는 가장 간단한 방법은 Google Cloud 콘솔에서 측정항목 탐색기의 PromQL 쿼리를 사용하는 것입니다.
PromQL 쿼리를 실행하려면 다음을 수행하세요.
Google Cloud Console에서 Monitoring 페이지로 이동하거나 다음 버튼을 클릭합니다.
탐색창에서
 측정항목 탐색기를 선택합니다.
Prometheus Query Language(PromQL)를 사용하여 차트에 표시할 데이터를 지정합니다.
측정항목 선택 창의 툴바에서 코드 편집기를 선택합니다.
언어 전환 버튼에서 PromQL을 선택합니다. 언어 전환은 코드 편집기 창 하단에 있습니다.
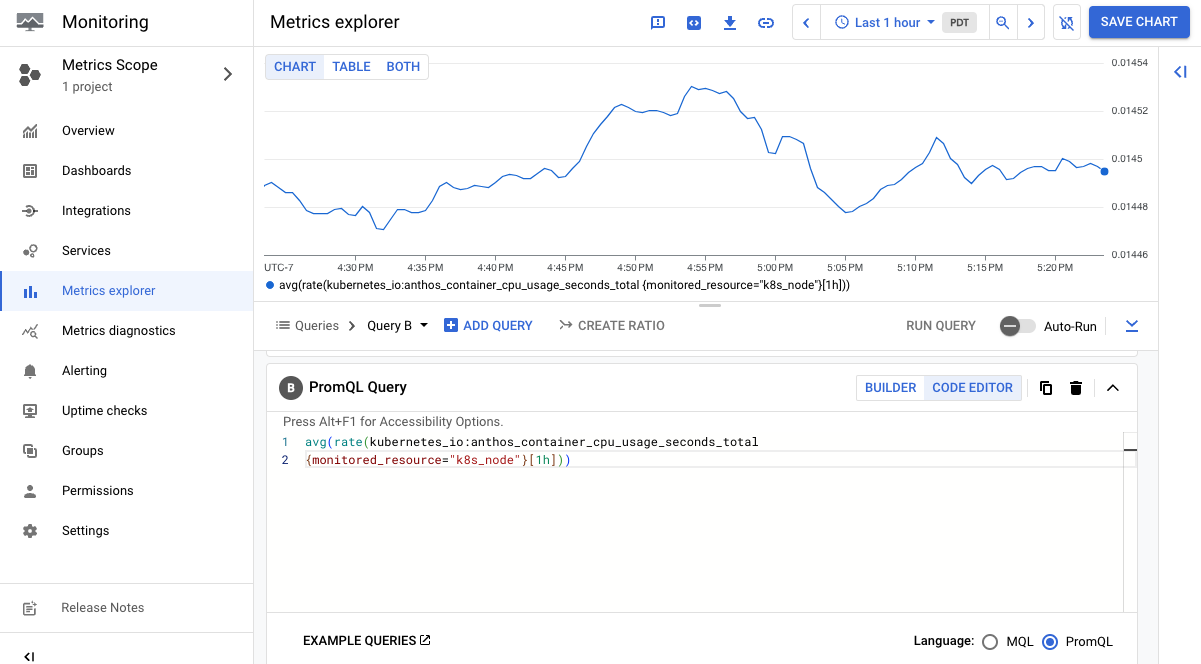
쿼리 편집기에 쿼리를 입력합니다. 예를 들어 이전 1시간 동안 각 모드에서 CPU가 소비한 평균 시간(초)을 차트로 표시하려면 다음 쿼리를 사용합니다.
avg(rate(kubernetes_io:anthos_container_cpu_usage_seconds_total
{monitored_resource="k8s_node"}[1h]))
PromQL 사용에 대한 자세한 내용은 Cloud Monitoring의 PromQL을 참조하세요.
다음은 anthos_container_cpu_usage_seconds_total 측정항목을 표시하는 차트를 보여주는 스크린샷입니다.
많은 양의 데이터를 수집하는 경우 비용 절감을 위해 내보낸 측정항목을 필터링해야 할 수 있습니다.
사용자 애플리케이션에 Cloud Logging 사용 설정
Cloud Logging 및 Cloud Monitoring 구성은 stackdriver라는 Stackdriver 객체에 저장됩니다.
수정할 Stackdriver 객체를 엽니다.
kubectl --kubeconfig=CLUSTER_KUBECONFIG \ --namespace kube-system edit stackdriver stackdriverCLUSTER_KUBECONFIG를 사용자 클러스터 kubeconfig 파일 경로로 바꿉니다.spec섹션에서enableCloudLoggingForApplications를true로 설정합니다.apiVersion: addons.gke.io/v1alpha1 kind: Stackdriver metadata: name: stackdriver namespace: kube-system spec: projectID: ... clusterName: ... clusterLocation: ... proxyConfigSecretName: ... enableCloudLoggingForApplications: true enableVPC: ... optimizedMetrics: true수정한 파일을 저장하고 닫습니다.
예시 애플리케이션 실행
이 섹션에서는 커스텀 로그를 작성하는 애플리케이션을 만듭니다.
다음 배치 매니페스트를
my-app.yaml이라는 파일에 저장합니다.apiVersion: apps/v1 kind: Deployment metadata: name: "monitoring-example" namespace: "default" labels: app: "monitoring-example" spec: replicas: 1 selector: matchLabels: app: "monitoring-example" template: metadata: labels: app: "monitoring-example" spec: containers: - image: gcr.io/google-samples/prometheus-dummy-exporter:latest name: prometheus-example-exporter imagePullPolicy: Always command: - /bin/sh - -c - ./prometheus-dummy-exporter --metric-name=example_monitoring_up --metric-value=1 --port=9090 resources: requests: cpu: 100m배포 만들기
kubectl --kubeconfig CLUSTER_KUBECONFIG apply -f my-app.yaml
애플리케이션 로그 보기
Console
Google Cloud 콘솔의 로그 탐색기로 이동합니다.
리소스를 클릭합니다. 모든 리소스 유형 메뉴에서 Kubernetes 컨테이너를 선택합니다.
CLUSTER_NAME에서 사용자 클러스터의 이름을 선택합니다.
NAMESPACE_NAME에서 기본값을 선택합니다.
추가를 클릭한 후 쿼리 실행을 클릭합니다.
쿼리 결과에서
monitoring-example배포의 로그 항목을 볼 수 있습니다. 예를 들면 다음과 같습니다.{ "textPayload": "2020/11/14 01:24:24 Starting to listen on :9090\n", "insertId": "1oa4vhg3qfxidt", "resource": { "type": "k8s_container", "labels": { "pod_name": "monitoring-example-7685d96496-xqfsf", "cluster_name": ..., "namespace_name": "default", "project_id": ..., "location": "us-west1", "container_name": "prometheus-example-exporter" } }, "timestamp": "2020-11-14T01:24:24.358600252Z", "labels": { "k8s-pod/pod-template-hash": "7685d96496", "k8s-pod/app": "monitoring-example" }, "logName": "projects/.../logs/stdout", "receiveTimestamp": "2020-11-14T01:24:39.562864735Z" }
gcloud CLI
다음 명령어를 실행합니다.
gcloud logging read 'resource.labels.project_id="PROJECT_ID" AND \ resource.type="k8s_container" AND resource.labels.namespace_name="default"'PROJECT_ID를 프로젝트의 ID로 바꿉니다.출력에서
monitoring-example배포의 로그 항목을 볼 수 있습니다. 예를 들면 다음과 같습니다.insertId: 1oa4vhg3qfxidt labels: k8s-pod/app: monitoring-example k8s- pod/pod-template-hash: 7685d96496 logName: projects/.../logs/stdout receiveTimestamp: '2020-11-14T01:24:39.562864735Z' resource: labels: cluster_name: ... container_name: prometheus-example-exporter location: us-west1 namespace_name: default pod_name: monitoring-example-7685d96496-xqfsf project_id: ... type: k8s_container textPayload: | 2020/11/14 01:24:24 Starting to listen on :9090 timestamp: '2020-11-14T01:24:24.358600252Z'
사용자 애플리케이션에 Logging 및 Monitoring 사용 설정(기존)
애플리케이션에 Logging 및 Monitoring을 사용 설정하려면 클러스터 구성 파일에 spec.clusterOperations.enableApplication 필드를 사용합니다.
클러스터 구성 파일을 업데이트하여
enableApplication을true로 설정합니다.apiVersion: v1 kind: Namespace metadata: name: cluster-user-basic --- apiVersion: baremetal.cluster.gke.io/v1 kind: Cluster metadata: name: user-basic namespace: cluster-user-basic spec: type: user ... clusterOperations: projectID: project-fleet location: us-central1 enableApplication: true ...bmctl update를 사용하여 변경사항을 적용합니다.bmctl update cluster -c CLUSTER_NAME --admin-kubeconfig=ADMIN_KUBECONFIG다음을 바꿉니다.
CLUSTER_NAME: 업그레이드할 클러스터의 이름ADMIN_KUBECONFIG: 관리자 클러스터 kubeconfig 파일의 경로
워크로드에 주석 추가
애플리케이션에서 커스텀 측정항목 수집을 사용 설정하려면 prometheus.io/scrape: "true" 주석을 애플리케이션의 서비스 또는 포드 매니페스트에 추가하거나 포드에 전달되도록 동일한 주석을 배포 또는 DaemonSet 매니페스트의 spec.template 섹션에 추가합니다.
예시 애플리케이션 실행
이 섹션에서는 커스텀 로그를 작성하고 커스텀 측정항목을 노출하는 애플리케이션을 만듭니다.
다음 서비스 및 배포 매니페스트를
my-app.yaml파일에 저장합니다. 서비스에는prometheus.io/scrape: "true"주석이 있습니다.kind: Service apiVersion: v1 metadata: name: "monitoring-example" namespace: "default" annotations: prometheus.io/scrape: "true" spec: selector: app: "monitoring-example" ports: - name: http port: 9090 --- apiVersion: apps/v1 kind: Deployment metadata: name: "monitoring-example" namespace: "default" labels: app: "monitoring-example" spec: replicas: 1 selector: matchLabels: app: "monitoring-example" template: metadata: labels: app: "monitoring-example" spec: containers: - image: gcr.io/google-samples/prometheus-dummy-exporter:latest name: prometheus-example-exporter imagePullPolicy: Always command: - /bin/sh - -c - ./prometheus-dummy-exporter --metric-name=example_monitoring_up --metric-value=1 --port=9090 resources: requests: cpu: 100m배포와 서비스를 만듭니다.
kubectl --kubeconfig CLUSTER_KUBECONFIG apply -f my-app.yaml
애플리케이션 로그 보기
Console
Google Cloud 콘솔의 로그 탐색기로 이동합니다.
리소스를 클릭합니다. 모든 리소스 유형에서 Kubernetes 컨테이너를 선택합니다.
CLUSTER_NAME에서 사용자 클러스터의 이름을 선택합니다.
NAMESPACE_NAME에서 기본값을 선택합니다.
추가를 클릭한 후 쿼리 실행을 클릭합니다.
쿼리 결과에서
monitoring-example배포의 로그 항목을 볼 수 있습니다. 예를 들면 다음과 같습니다.{ "textPayload": "2020/11/14 01:24:24 Starting to listen on :9090\n", "insertId": "1oa4vhg3qfxidt", "resource": { "type": "k8s_container", "labels": { "pod_name": "monitoring-example-7685d96496-xqfsf", "cluster_name": ..., "namespace_name": "default", "project_id": ..., "location": "us-west1", "container_name": "prometheus-example-exporter" } }, "timestamp": "2020-11-14T01:24:24.358600252Z", "labels": { "k8s-pod/pod-template-hash": "7685d96496", "k8s-pod/app": "monitoring-example" }, "logName": "projects/.../logs/stdout", "receiveTimestamp": "2020-11-14T01:24:39.562864735Z" }
gcloud CLI
다음 명령어를 실행합니다.
gcloud logging read 'resource.labels.project_id="PROJECT_ID" AND \ resource.type="k8s_container" AND resource.labels.namespace_name="default"'PROJECT_ID를 프로젝트의 ID로 바꿉니다.출력에서
monitoring-example배포의 로그 항목을 볼 수 있습니다. 예를 들면 다음과 같습니다.insertId: 1oa4vhg3qfxidt labels: k8s-pod/app: monitoring-example k8s- pod/pod-template-hash: 7685d96496 logName: projects/.../logs/stdout receiveTimestamp: '2020-11-14T01:24:39.562864735Z' resource: labels: cluster_name: ... container_name: prometheus-example-exporter location: us-west1 namespace_name: default pod_name: monitoring-example-7685d96496-xqfsf project_id: ... type: k8s_container textPayload: | 2020/11/14 01:24:24 Starting to listen on :9090 timestamp: '2020-11-14T01:24:24.358600252Z'
Google Cloud 콘솔에서 애플리케이션 측정항목 보기
예시 애플리케이션은 example_monitoring_up이라는 커스텀 측정항목을 노출합니다.
Google Cloud 콘솔에서 해당 측정항목의 값을 볼 수 있습니다.
Google Cloud 콘솔의 측정항목 탐색기로 이동합니다.
리소스 유형에서
Kubernetes Pod또는Kubernetes Container를 선택합니다.측정항목에서
external.googleapis.com/prometheus/example_monitoring_up을 선택합니다.차트에서
example_monitoring_up의 반복되는 값이 1인 것을 알 수 있습니다.