앱을 만든 후 배포 단계에서 앱 모니터링을 사용 설정한 다음 앱 성능에 관한 측정항목을 볼 수 있습니다.
모니터링이 사용 설정된 앱 배포
필요한 모든 구성요소로 엔드 투 엔드 애플리케이션을 빌드한 후에는 앱을 배포해야 사용할 수 있습니다. 배포 시 모니터링을 사용 설정할 수 있습니다.
콘솔
Vertex AI Vision 대시보드의 애플리케이션 탭을 엽니다.
목록에서 애플리케이션 이름 옆에 있는 앱 보기를 선택합니다.
애플리케이션 그래프 빌더 페이지에서 배포 버튼을 클릭합니다.
열리는 애플리케이션 배포 메뉴에서 다른 옵션을 선택하고 이 애플리케이션에 모니터링 사용 설정을 선택합니다.
배포를 클릭합니다.
배포가 완료되면 노드 옆에 녹색 체크표시가 표시됩니다.
앱 모니터링 측정항목 보기
앱이 배포된 후 몇 분 후에 다양한 모델에서 다양한 외부 서비스 (예: BigQuery 또는 Cloud Run 함수)에 대한 요청 수를 나타내는 그래프와 같은 일부 앱 측정항목에 액세스할 수 있습니다.
콘솔
Vertex AI Vision 대시보드의 애플리케이션 탭을 엽니다.
목록에서 애플리케이션 이름 옆에 있는 앱 보기를 선택합니다.
애플리케이션 그래프 빌더 페이지에서 세부정보 보기 버튼을 클릭합니다.
이 뷰에서는 앱 요청 수, 가동 시간과 같은 측정항목을 확인할 수 있습니다.
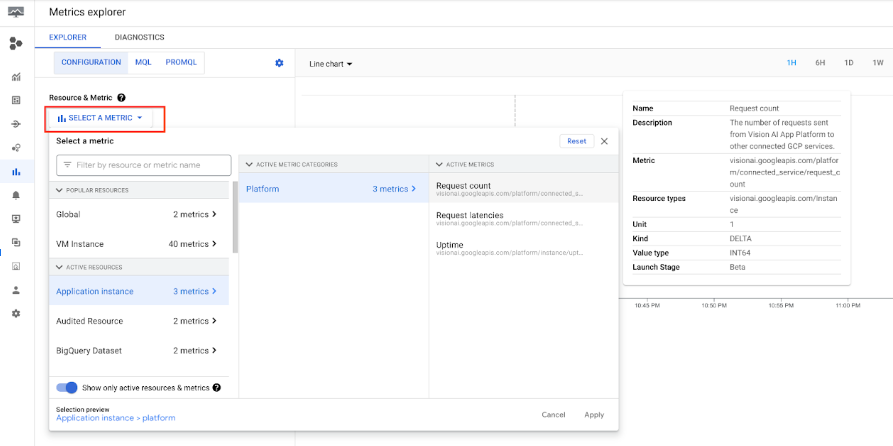
자세한 내용을 보려면 측정항목 탐색기 열기 버튼을 클릭합니다.
특정 측정항목을 보려면 측정항목 선택을 클릭하고 측정항목을 선택합니다.
다음 단계
- 스트림 만들기 및 관리에서 앱의 입력 스트림에서 데이터 처리를 시작하는 방법에 관한 안내를 읽습니다.
- 애플리케이션 관리에서 앱을 나열하고 배포된 앱의 인스턴스를 보는 방법을 알아보세요.
- 스트림 데이터 읽기에서 처리 스트림 또는 분석된 모델 출력 데이터에서 앱 입력 데이터를 읽는 방법을 알아보세요.