このドキュメントでは、Cloud Logging ログビューアを使用してログを確認する方法について説明します。
始める前に
Cloud Logging API を使用するようにアプリケーションを構成します。
アカウントにログインして、 Google Cloud リソースにアクセスします。
- [ツール] -> [Google Cloud Tools] -> [Manage Accounts...] を選択し、自分のアカウントを選択します。
ログ エクスプローラへのアクセス
Cloud Logging ログ エクスプローラにアクセスするには、[ツール] -> [Google Cloud Tools] -> [Show Stackdriver Logs Explorer] を選択します。
[Google Stackdriver Logging] タブが開きます。
または、[ツール] -> [Google Cloud Tools] -> [Google Cloud Explorer] を選択して、Google Cloud Explorer から特定のプロジェクトのログ エクスプローラを開くこともできます。プロジェクトを右クリックし、[Browse Stackdriver Logs] を選択します。
インターフェースの使い方
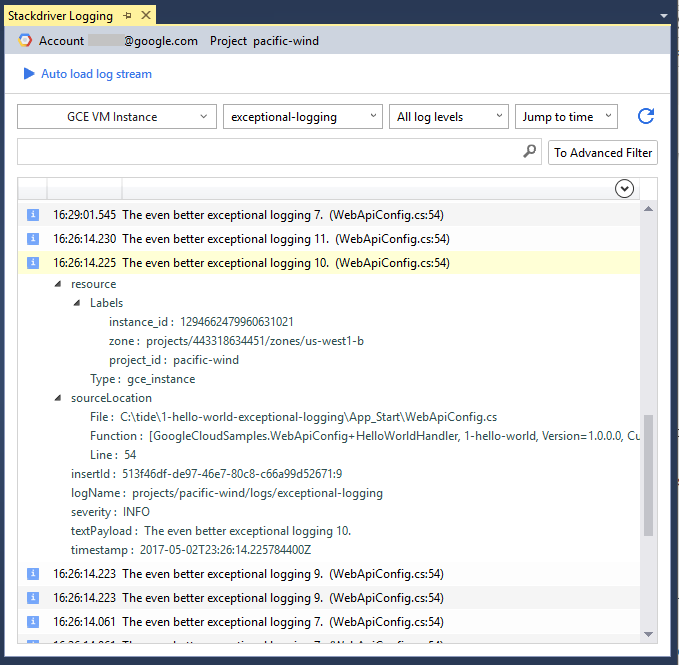
ログ エクスプローラのインターフェースの主要なコンポーネントには、次のようなものがあります。
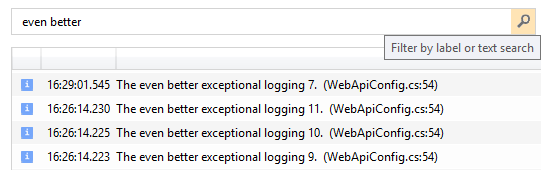
検索バーでは、ラベルまたはテキスト検索によりログエントリをフィルタリングできます。
プルダウン メニューでは、リソース、ログ、重大度レベルによりリストをフィルタリングできます。
[時間を選択] プルダウン メニューでは、ログの特定の日時を表示できます。
[更新] ボタンでは、最新のログを降順で取得できます。
[Auto load log stream] では、新しいログエントリの到着時に表示するかどうかを制御できます。
[再生] をクリックすると、最新のログのストリームが開始されます。ログ画面をスクロールすると、ストリームは停止します。
[一時停止] をクリックすると、ログストリームが停止します。
ログの概要表では、個々のログエントリをクリックして詳細を表示できます。
ログエントリ パネルの右上隅にある [すべて展開] 下矢印をクリックすると、すべてのログエントリの詳細が表示されます。パネルに多数のログエントリが表示されている場合、この処理には時間がかかることがあります。
ログエントリを生成するソースコードを探すためのソースリンクが表示されます(可能な場合)。
ソースコードへの移動
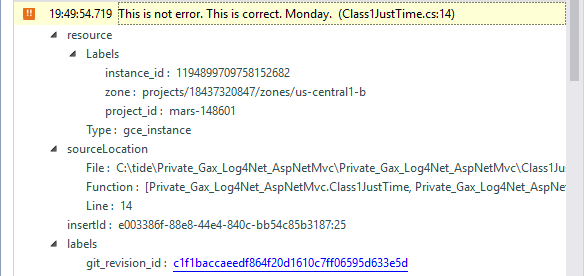
ログ エクスプローラでは、ログエントリを生成するソースコードに移動できます。この機能を有効にするには、ローカルの git リポジトリからプロジェクトをビルドし、ログエントリにソースのロケーション情報を追加する必要があります。
ログへのソースのロケーションの追加
ログにソースコードのロケーション情報を提供するようにアプリケーションを構成します。
次の GitHub のサンプルを使用して、ログエントリのロケーション情報を書き込みます。
アプリケーションのルートに
source_context.jsonファイルをデプロイします。Cloud Tools for Visual Studio を使用してソリューションを発行すると、拡張機能によって自動的にファイルが生成されてデプロイされます。
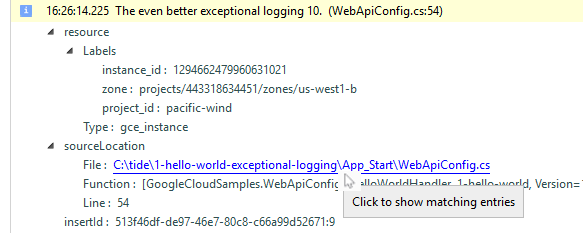
これらの手順を完了すると、ログエントリに、ファイルと行の情報を含む sourceLocation フィールドが含まれます。オプションの関数行には、アセンブリ名、バージョン、関数名を含めることができます。
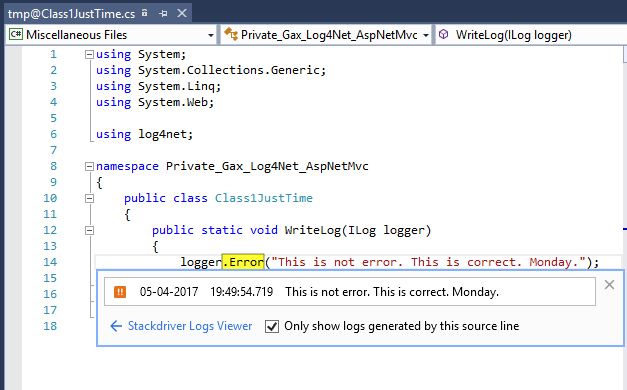
ソースファイルにアクセスできる場合は、ソースリンクをクリックするとソースコードに移動します。
ログの表示
ログ エクスプローラ インターフェースでは、ログエントリをフィルタリングしたり、表示する特定のログを検索したりできます。
ログのフィルタリング
ログエントリをフィルタリングして、関心のあるログだけを表示できます。
リソースタイプとインスタンスのプルダウン メニューでは、表示する特定のリソースタイプのすべてのインスタンスを選択したり、特定のインスタンスを表示したりできます。 リソースタイプの一覧については、モニタリング対象リソースとサービスをご覧ください。
ログタイプのプルダウン メニューでは、表示するログ名を選択するか、[すべてのログ] を選択します。このメニューには、選択したリソースが生成するログのみが表示されます。
ログの重大度のプルダウン メニューでは、表示する重大度レベルを選択します。[すべてのログレベル] を選択すると、重大度レベルではないログエントリが含まれます。
[時間を選択] プルダウン メニューでは、日時を選択します。選択したタイムスタンプの前または後のどちらのログを表示するかを選択します。
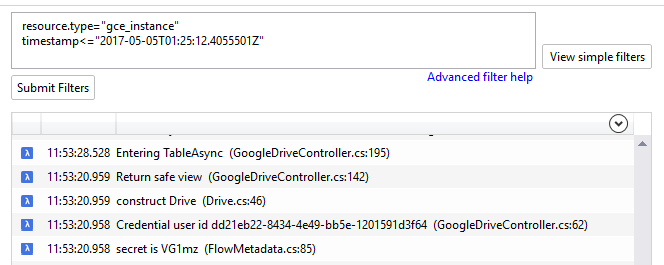
また、[To Advanced Filter] をクリックして高度なフィルタバーにアクセスし、クエリを使用してログエントリをフィルタリングすることもできます。詳しくは、[高度なフィルタのヘルプ] をクリックしてください。
ログの検索
検索バーで、ログエントリに出現するキーワードを検索します。
類似したログの表示
展開されたログエントリ ビューの個別のフィールドの値をクリックしてから、同じ値のすべてのログエントリを表示または非表示にすることができます。
類似したログエントリを表示する場合は、高度なフィルタバーが表示されます。ここでフィルタを編集して、[フィルタを送信] をクリックします。詳しくは、[高度なフィルタのヘルプ] をクリックしてください。