Cloud Shell 편집기를 사용하면 애플리케이션을 쉽게 디버깅할 수 있습니다.
편집기의 디버깅 지원을 사용하면 포트 전달 설정 또는 언어별 디버그 인수 삽입과 같은 수동 설정을 건너뛸 수 있습니다. 편집기에서 실행 구성을 만들고, 중단점을 설정하고, 변수를 검사할 수 있습니다.
디버그 작업
Cloud Shell 편집기의 디버깅 지원에 액세스하려면 작업 표시줄의 디버그를 클릭합니다. 샘플 애플리케이션은 애플리케이션을 실행하고 디버깅하는 데 필요한 launch.json 파일이 함께 제공됩니다. 애플리케이션에 이 파일이 없는 경우 파일을 만들라는 메시지가 디버그 뷰에 표시됩니다.
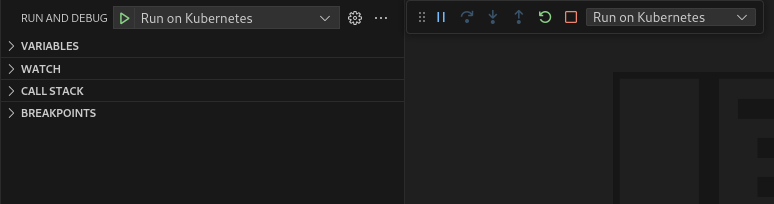
디버그 뷰에서 시작을 클릭하여 디버깅 세션을 시작합니다.
메시지가 표시되면, 앱을 실행할 컨텍스트를 선택하고 해당하는 경우 사용할 이미지 레지스트리를 선택합니다.
디버깅 세션이 시작된 후 디버깅 작업 아이콘(일시중지, Step In, Step in, Step Out, 재시작, 중지 아이콘)으로 관리할 수 있습니다.
중단점 설정
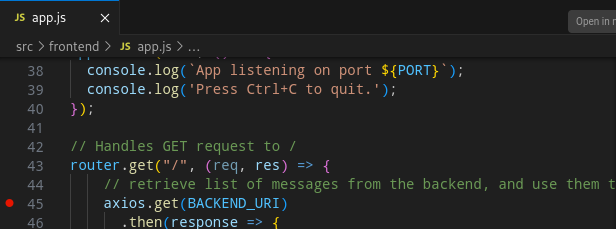
중단점을 설정하거나 전환하려면 중단하려는 선 옆의 편집기 여백을 클릭합니다. 빨간색 원은 활성 중단점이고 회색 원은 비활성 중단점입니다. 세션이 시작될 때 중단점을 디버거로 등록할 수 없는 경우 속이 빈 회색 원으로 변경됩니다.
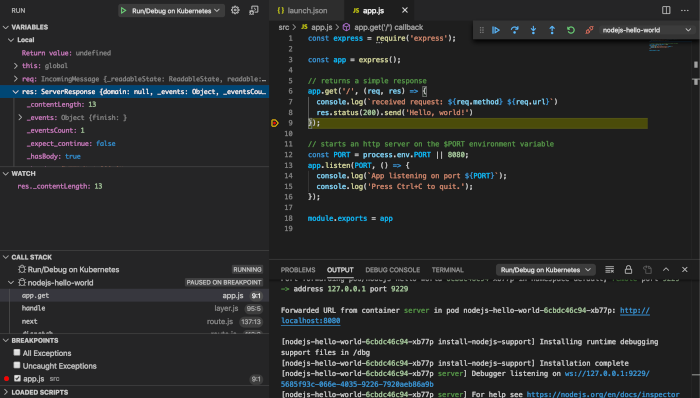
디버깅 세션을 실행할 때 앱이 중단점에서 중지되면 디버그 뷰의 변수 패널을 검사하여 앱이 일시중지되었을 때 변수 값을 검사할 수 있습니다.
추가 Kubernetes 디버깅 지원
Cloud Shell 편집기를 사용하면 로컬 클러스터(예를 들어 minikube 또는 Docker Desktop)에서, 또는 GKE 또는 기타 클라우드 제공업체의 원격 클러스터에서 Kubernetes 애플리케이션을 디버깅할 수 있습니다. 또한 Kubernetes 포드에 디버거를 연결할 수도 있습니다.
[[["이해하기 쉬움","easyToUnderstand","thumb-up"],["문제가 해결됨","solvedMyProblem","thumb-up"],["기타","otherUp","thumb-up"]],[["이해하기 어려움","hardToUnderstand","thumb-down"],["잘못된 정보 또는 샘플 코드","incorrectInformationOrSampleCode","thumb-down"],["필요한 정보/샘플이 없음","missingTheInformationSamplesINeed","thumb-down"],["번역 문제","translationIssue","thumb-down"],["기타","otherDown","thumb-down"]],["최종 업데이트: 2025-09-04(UTC)"],[],[],null,["# Debug with Cloud Shell Editor\n\n| **Note:** Debugging support is available for Go, Node.js, Python, Java, and Ruby applications.\n\nThe Cloud Shell Editor allows you to easily debug your application.\nWith the editor's debugging support, you skip manual setup like setting up port\nforwarding or injecting language-specific debug arguments. You can create launch\nconfigurations, set breakpoints, and inspect variables, all in the editor.\n\nDebug actions\n-------------\n\nTo access the Cloud Shell Editor's debugging support, click\n**Debug** in the\nActivity bar. Sample applications come with a `launch.json` file needed to run\nand debug your application. If your application doesn't have one, you're\nprompted in the Debug View to create one.\n\nIn the Debug View, start a debugging session by clicking\n**Start**.\nWhen prompted, choose the context to run your app in and, if applicable, the\nimage registry to use.\n\nAfter your debugging session starts, you can manage it with the Debugging action\nicons: Pause, Step over, Step in, Step out, Restart, Stop.\n\nSet breakpoints\n---------------\n\nTo set or toggle breakpoints, click in the editor margin next to the line you\nwant to break at. Red circles are active breakpoints and gray circles\nare inactive breakpoints. If a breakpoint can't be registered with\nthe debugger when a session starts, it changes to a gray-outlined hollow circle.\n\nWhen running a debugging session, the app stops at the breakpoint and you can\ninspect the Variables panel in the Debug View to inspect variable values as the\napp is paused.\n\nAdditional Kubernetes debugging support\n---------------------------------------\n\nWith the Cloud Shell Editor, you can debug Kubernetes applications on\na local cluster (like minikube or Docker Desktop) or a remote cluster on\nGKE or any other Cloud provider. You can also attach a\ndebugger to a Kubernetes pod.\n\nRefer to the [Debugging Kubernetes applications](/code/docs/shell/debug)\nusing the Cloud Shell Editor guide for more details."]]