最佳化 Go 應用程式
在本教學課程中,您會部署刻意降低效率的 Go 應用程式,並設定收集設定檔資料。您可以使用 Profiler 介面查看設定檔資料,並找出可進行的最佳化。接著,您修改應用程式、部署應用程式,並評估修改效果。
事前準備
- Sign in to your Google Cloud account. If you're new to Google Cloud, create an account to evaluate how our products perform in real-world scenarios. New customers also get $300 in free credits to run, test, and deploy workloads.
-
In the Google Cloud console, on the project selector page, select or create a Google Cloud project.
Roles required to select or create a project
- Select a project: Selecting a project doesn't require a specific IAM role—you can select any project that you've been granted a role on.
-
Create a project: To create a project, you need the Project Creator
(
roles/resourcemanager.projectCreator), which contains theresourcemanager.projects.createpermission. Learn how to grant roles.
-
Enable the required API.
Roles required to enable APIs
To enable APIs, you need the Service Usage Admin IAM role (
roles/serviceusage.serviceUsageAdmin), which contains theserviceusage.services.enablepermission. Learn how to grant roles. - 如要開啟 Cloud Shell,請在 Google Cloud 控制台工具列中,按一下「啟用 Cloud Shell」:

稍後,Cloud Shell 工作階段會在Google Cloud 控制台中開啟:
在 Cloud Shell 中執行下列指令:
git clone https://github.com/GoogleCloudPlatform/golang-samples.git
cd golang-samples/profiler/shakesapp
執行應用程式,將版本設為
1,並將回合數設為 15:go run . -version 1 -num_rounds 15一兩分鐘後,系統就會顯示設定檔資料。設定檔資料如下所示:
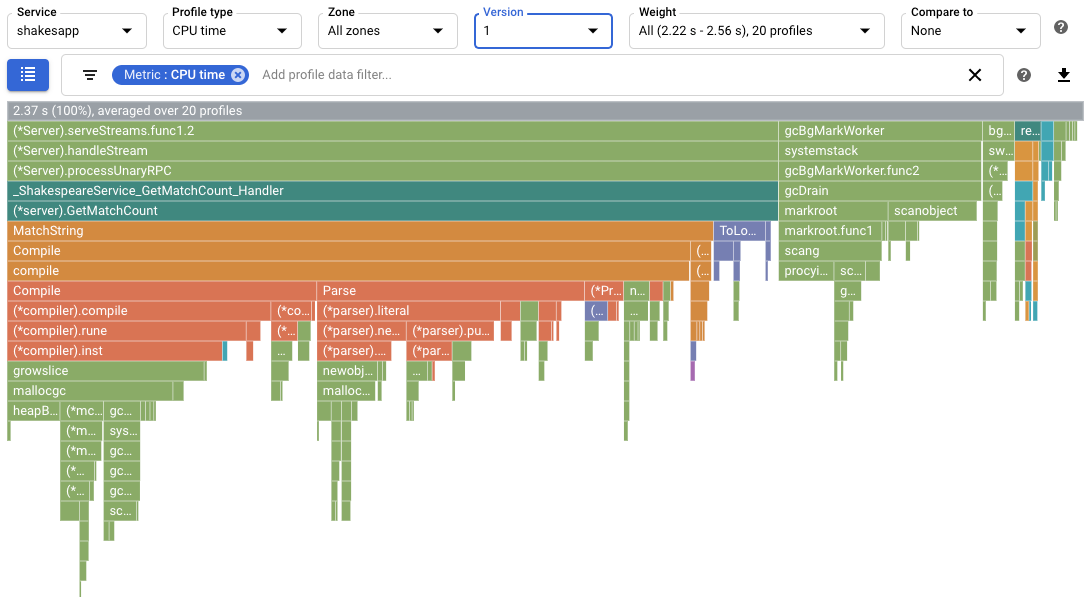
在螢幕截圖中,請注意「Profile type」(設定檔類型) 已設為
CPU time。 這表示火焰圖中顯示的是 CPU 使用率資料。Cloud Shell 中列印的輸出範例如下所示:
$ go run . -version 1 -num_rounds 15
2020/08/27 17:27:34 Simulating client requests, round 1
2020/08/27 17:27:34 Stackdriver Profiler Go Agent version: 20200618
2020/08/27 17:27:34 profiler has started
2020/08/27 17:27:34 creating a new profile via profiler service
2020/08/27 17:27:51 Simulated 20 requests in 17.3s, rate of 1.156069 reqs / sec
2020/08/27 17:27:51 Simulating client requests, round 2
2020/08/27 17:28:10 Simulated 20 requests in 19.02s, rate of 1.051525 reqs / sec
2020/08/27 17:28:10 Simulating client requests, round 3
2020/08/27 17:28:29 Simulated 20 requests in 18.71s, rate of 1.068947 reqs / sec
...
2020/08/27 17:44:32 Simulating client requests, round 14
2020/08/27 17:46:04 Simulated 20 requests in 1m32.23s, rate of 0.216849 reqs / sec
2020/08/27 17:46:04 Simulating client requests, round 15
2020/08/27 17:47:52 Simulated 20 requests in 1m48.03s, rate of 0.185134 reqs / sec
Cloud Shell 輸出內容會顯示每次疊代的經過時間和平均要求率。應用程式啟動時,「Simulated 20 requests in 17.3s, rate of 1.156069 reqs / sec」項目表示伺服器每秒執行約 1 個要求。在最後一輪中,「Simulated 20 requests in 1m48.03s, rate of 0.185134 reqs / sec」項目表示伺服器大約每 5 秒執行 1 項要求。
- 如要查看表格,請按一下 list「Focus function list」(聚焦函式清單)。
- 按「總計」排序表格。標示為「Total」(總計) 的資料欄會顯示函式及其子項的 CPU 作業時間用量。
在本例中,
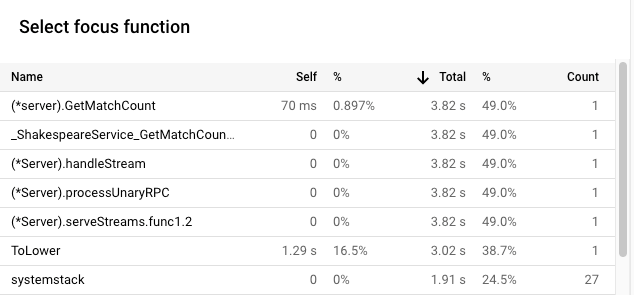
GetMatchCount是列出的第一個shakesapp/server.go函式。該函式使用了 1.7 秒的 CPU 總作業時間, 或應用程式 CPU 總作業時間的 72%。 這個函式會處理 gRPC 要求。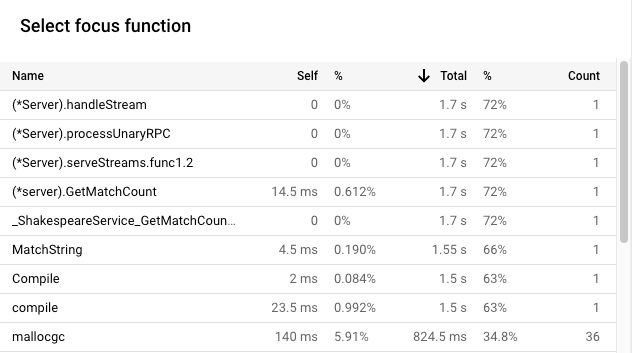
火焰圖顯示
shakesapp/server.go函式GetMatchCount呼叫MatchString,而MatchString則將大部分時間用於呼叫Compile: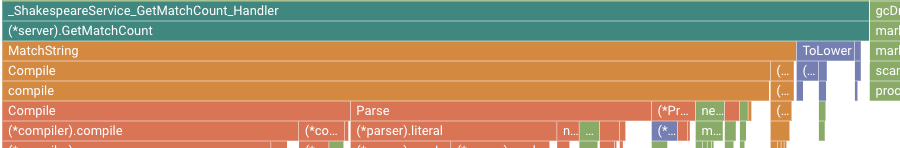
執行應用程式,並將應用程式版本設為
2:go run . -version 2 -num_rounds 40稍後會說明,經過最佳化後,執行單一回合所需的時間遠少於未修改的應用程式。為確保應用程式執行時間足夠長,可收集及上傳設定檔,因此增加了回合數。
等待應用程式完成,然後查看這個應用程式版本的剖析資料:
- 按一下「立即」即可載入最新的商家檔案資料。詳情請參閱「時間範圍」一節。
- 在「版本」選單中選取「2」。
每秒要求數從每秒不到 1 個增加到每秒 5.8 個。
CPU 使用率除以每秒要求數後,每個要求的 CPU 時間從 23.7% 降至 13.4%。
請注意,雖然 CPU 時間用量從 2.37 秒 (相當於單一 CPU 核心的 23.7% 使用率) 增加到 7.8 秒 (相當於 CPU 核心的 78%),但每個要求的 CPU 時間仍減少。
堆積設定檔會顯示在收集設定檔時,程式堆積中分配到的記憶體大小。
「分配的堆積」設定檔會顯示在收集設定檔的間隔期間,程式堆積中分配到的記憶體總量。將這些值除以 10 秒 (設定檔收集間隔),即可解讀為分配率。
執行應用程式,並將應用程式版本設為
3,然後啟用堆積和已分配堆積設定檔的收集作業。go run . -version 3 -num_rounds 40 -heap -heap_alloc等待應用程式完成,然後查看這個應用程式版本的剖析資料:
- 按一下「立即」即可載入最新的設定檔資料。
- 在「版本」選單中,選取「3」。
- 在「分析器類型」選單中,選取「已分配的堆積」。
舉例來說,火焰圖如下所示:
- 如果 CPU 時間用量低於 5%,請略過最佳化程序。
- 如果 CPU 時間用量至少為 25%,請進行最佳化。
執行應用程式,並將應用程式版本設為
4:go run . -version 4 -num_rounds 60 -heap -heap_alloc等待應用程式完成,然後查看這個應用程式版本的剖析資料:
- 按一下「立即」即可載入最新的設定檔資料。
- 在「版本」選單中,選取「4」。
- 在「分析器類型」選單中,選取「已分配的堆積」。
如要量化變更
readFiles對堆積分配率的影響,請比較版本 4 的已分配堆積剖析資料與版本 3 的資料: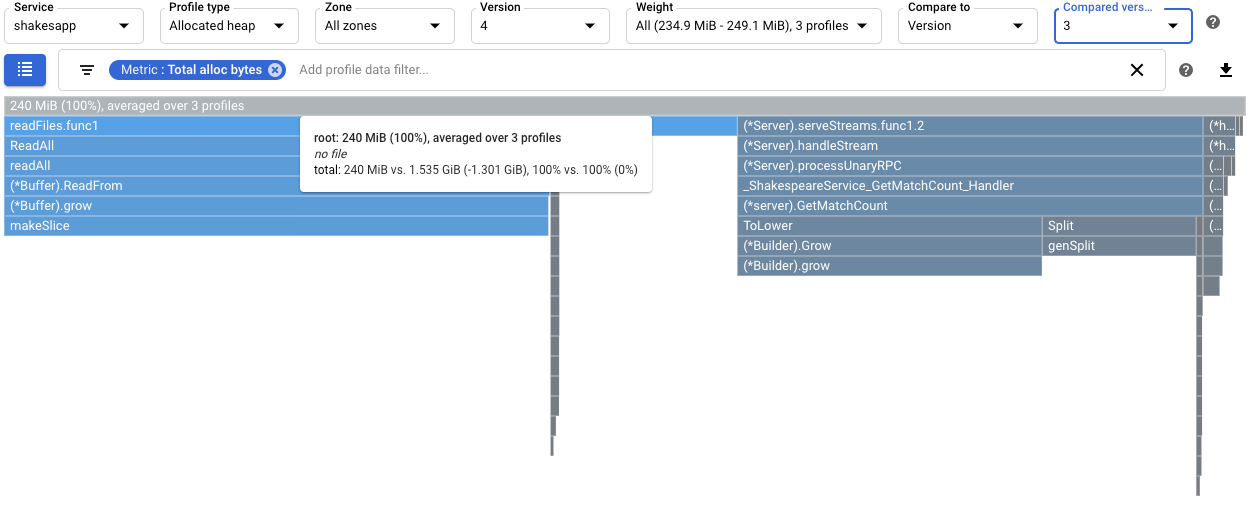
根架構的工具提示顯示,與第 3 版相比,第 4 版在剖析資料收集期間分配的平均記憶體量減少了 1.301 GiB。
readFiles.func1的工具提示顯示減少 1.045 GiB: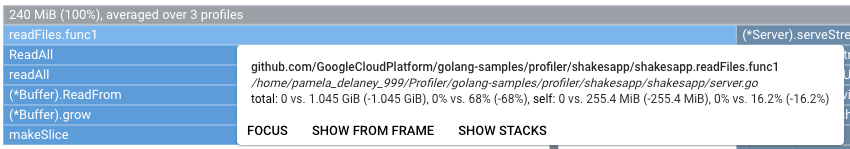
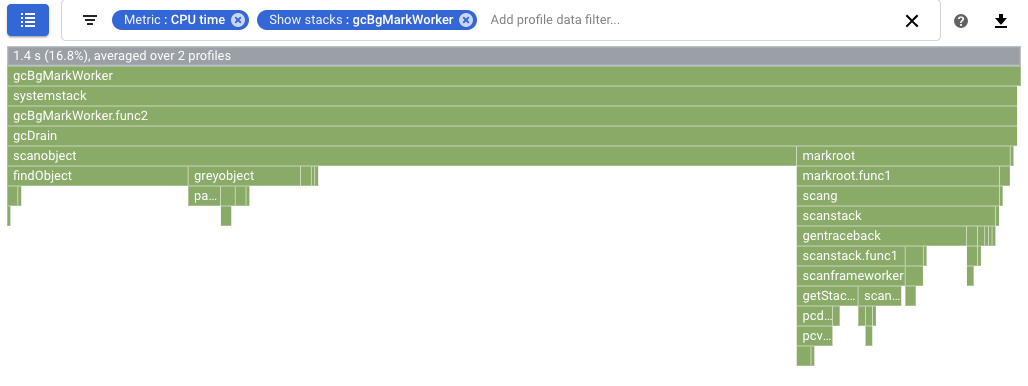
如要量化垃圾收集的影響,請設定 CPU 作業時間剖析資料的比較。在下列螢幕截圖中,系統已套用篩選器,顯示 Go 垃圾收集器的堆疊
runtime.gcBgMarkWorker.*。螢幕截圖顯示垃圾收集的 CPU 使用率從 16.8% 降至 4.97%。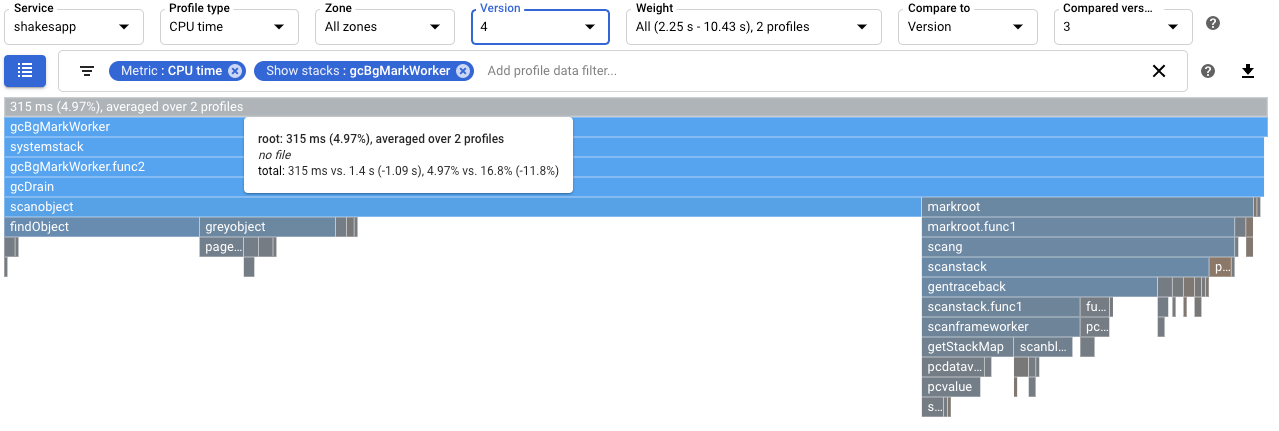
如要判斷這項變更是否會影響應用程式每秒處理的要求數,請查看 Cloud Shell 中的輸出內容。在本例中,第 4 版每秒最多可完成 15 個要求,遠高於第 3 版的每秒 5.8 個要求:
$ go run . -version 4 -num_rounds 60 -heap -heap_alloc 2020/08/27 21:51:42 Simulating client requests, round 1 2020/08/27 21:51:42 Stackdriver Profiler Go Agent version: 20200618 2020/08/27 21:51:42 profiler has started 2020/08/27 21:51:42 creating a new profile via profiler service 2020/08/27 21:51:44 Simulated 20 requests in 1.47s, rate of 13.605442 reqs / sec 2020/08/27 21:51:44 Simulating client requests, round 2 2020/08/27 21:51:45 Simulated 20 requests in 1.3s, rate of 15.384615 reqs / sec 2020/08/27 21:51:45 Simulating client requests, round 3 2020/08/27 21:51:46 Simulated 20 requests in 1.31s, rate of 15.267176 reqs / sec ...
應用程式每秒處理的查詢次數增加,可能是因為垃圾收集所花的時間減少。
如要更全面瞭解修改對
readFiles的影響,請查看堆積設定檔。比較第 4 版和第 3 版的堆積剖析資料後,可看出堆積用量從 70.95 MiB 減少至 18.47 MiB: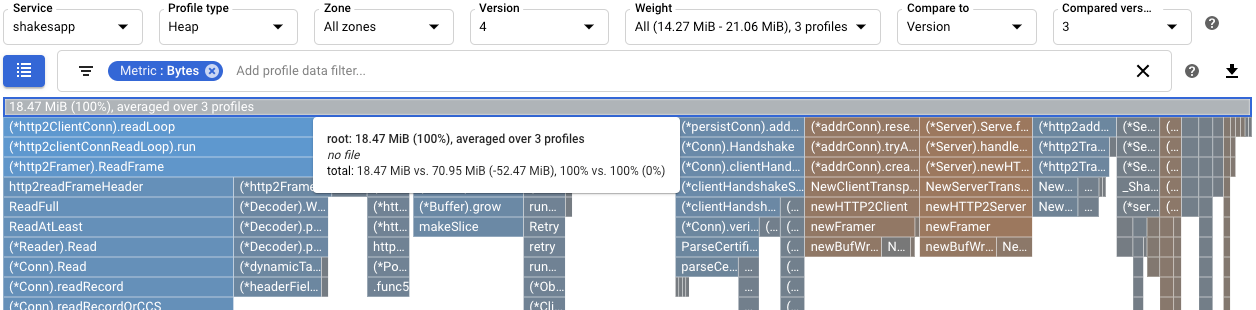
使用 CPU 時間設定檔時,系統會識別出 CPU 密集型函式。 套用簡單變更後,伺服器的要求頻率從每秒約 1 次增加至每秒 5.8 次。
使用已分配的堆積剖析,發現
shakesapp/server.go函式readFiles的分配率偏高。最佳化readFiles後,伺服器的要求傳送頻率提高至每秒 15 次,且在 10 秒的剖析資料收集期間,平均分配到的記憶體量減少了 1.301 GiB。
應用程式範例
主要目標是盡可能提高伺服器每秒可處理的查詢次數。次要目標是減少記憶體用量,方法是消除不必要的記憶體配置。
伺服器會使用 gRPC 架構接收字詞或詞組,然後傳回該字詞或詞組在莎士比亞作品中出現的次數。
伺服器每秒可處理的平均查詢次數,取決於伺服器的工作負載測試。在每輪測試中,系統會呼叫用戶端模擬器,並指示發出 20 個連續查詢。一輪完成後,系統會顯示用戶端模擬器傳送的查詢數量、經過的時間,以及每秒平均查詢數量。
伺服器程式碼刻意降低效率。
執行範例應用程式
下載並執行範例應用程式:
使用 CPU 時間設定檔,盡可能提高每秒查詢次數
如要盡可能提高每秒查詢次數,其中一個方法是找出耗用大量 CPU 的方法,並最佳化實作方式。在本節中,您會使用 CPU 時間設定檔,找出伺服器中耗用大量 CPU 的方法。
找出 CPU 時間用量
火焰圖的根框架會列出應用程式在 10 秒的收集間隔內使用的 CPU 總時間:
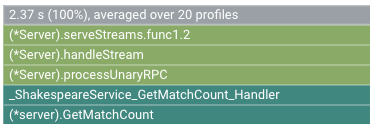
在本範例中,使用的服務為 2.37 s。如果系統在單一核心上執行,2.37 秒的 CPU 時間用量就相當於該核心的 23.7% 使用率。詳情請參閱可用的剖析類型。
修改應用程式
步驟 1:哪個函式耗用大量 CPU 時間?
如要找出可能需要最佳化的程式碼,其中一種方法是查看函式表格,並找出貪婪函式:
評估變更
如要評估變更,請按照下列步驟操作:
舉例來說,火焰圖如下所示:
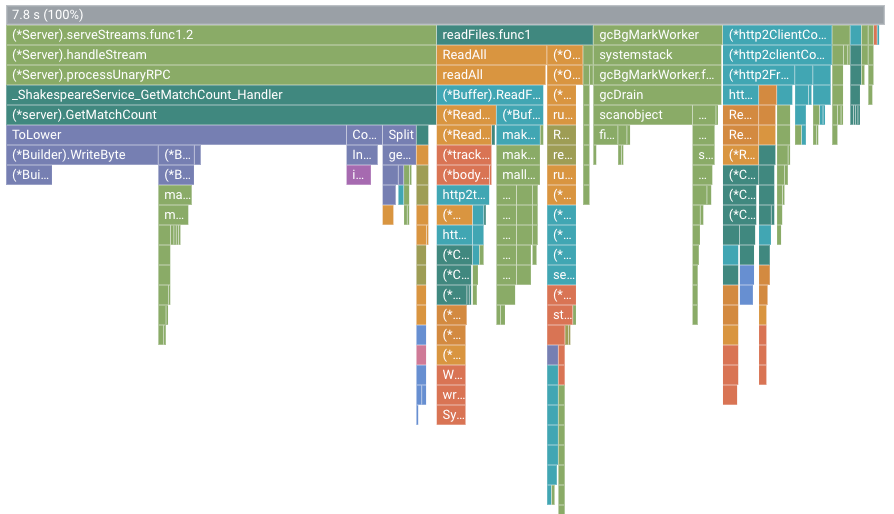
在本圖中,根框架顯示的值為 7.8 s。由於變更了字串比對函式,應用程式使用的 CPU 時間從 2.37 秒增加到 7.8 秒,也就是應用程式從使用 23.7% 的 CPU 核心,增加到使用 78% 的 CPU 核心。
影格寬度是 CPU 時間用量的比例測量值。在這個範例中,GetMatchCount 的框架寬度表示該函式約佔應用程式所用 CPU 作業時間的 49%。在原始火焰圖中,這個影格約占圖表寬度的 72%。如要查看確切的 CPU 時間用量,可以使用影格工具提示,或使用「Focus function list」(聚焦函式清單):
Cloud Shell 的輸出內容顯示,修改後的版本每秒完成約 5.8 個要求:
$ go run . -version 2 -num_rounds 40
2020/08/27 18:21:40 Simulating client requests, round 1
2020/08/27 18:21:40 Stackdriver Profiler Go Agent version: 20200618
2020/08/27 18:21:40 profiler has started
2020/08/27 18:21:40 creating a new profile via profiler service
2020/08/27 18:21:44 Simulated 20 requests in 3.67s, rate of 5.449591 reqs / sec
2020/08/27 18:21:44 Simulating client requests, round 2
2020/08/27 18:21:47 Simulated 20 requests in 3.72s, rate of 5.376344 reqs / sec
2020/08/27 18:21:47 Simulating client requests, round 3
2020/08/27 18:21:51 Simulated 20 requests in 3.58s, rate of 5.586592 reqs / sec
...
2020/08/27 18:23:51 Simulating client requests, round 39
2020/08/27 18:23:54 Simulated 20 requests in 3.46s, rate of 5.780347 reqs / sec
2020/08/27 18:23:54 Simulating client requests, round 40
2020/08/27 18:23:58 Simulated 20 requests in 3.4s, rate of 5.882353 reqs / sec
應用程式的微小變更產生了兩種不同的影響:
使用已分配的堆積設定檔來提升資源用量
本節說明如何使用堆積和已分配堆積的剖析檔,找出應用程式中耗用大量分配空間的方法:
啟用堆積設定檔收集功能
找出堆積分配率
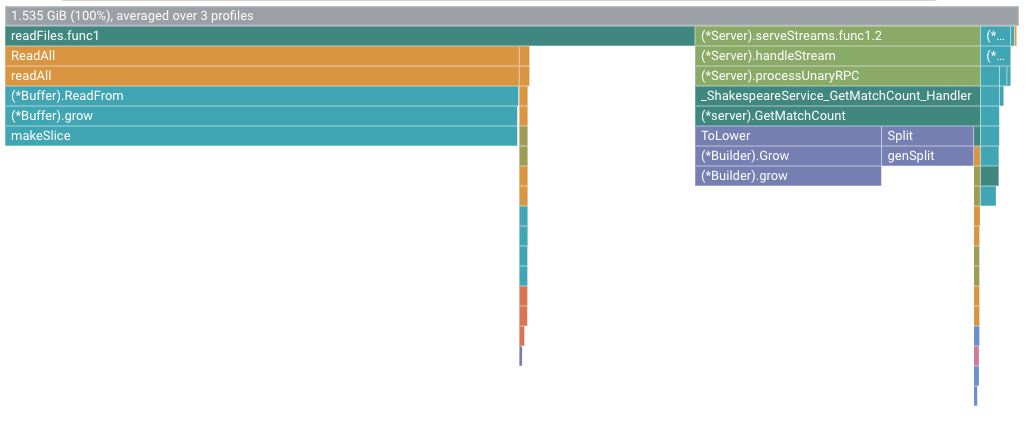
根框架會顯示在收集剖析資料的 10 秒期間內分配到的堆積總量,並計算所有剖析資料的平均值。在本例中,根框架顯示平均分配了 1.535 GiB 的記憶體。
修改應用程式
步驟 1:是否值得盡量減少堆積分配率?
Go 背景垃圾收集函式的 CPU 時間用量 (runtime.gcBgMarkWorker.*) 可用於判斷是否值得費力最佳化應用程式,以降低垃圾收集費用:
在本例中,背景垃圾收集器的 CPU 時間使用率為 16.8%。這個值夠高,值得嘗試最佳化 shakesapp/server.go:
步驟 2:哪個函式分配了大量記憶體?
shakesapp/server.go 檔案包含兩個可能成為最佳化目標的函式:GetMatchCount 和 readFiles。如要判斷這些函式的記憶體配置率,請將「設定檔類型」設為「已配置的堆積」,然後使用 list「聚焦函式清單」。
在這個範例中,在 10 秒的剖析資料收集期間,readFiles.func1 的堆積分配總量平均為 1.045 GiB,或佔分配記憶體總量的 68%。在 10 秒的剖析資料收集期間,自我堆積分配量為 255.4 MiB:
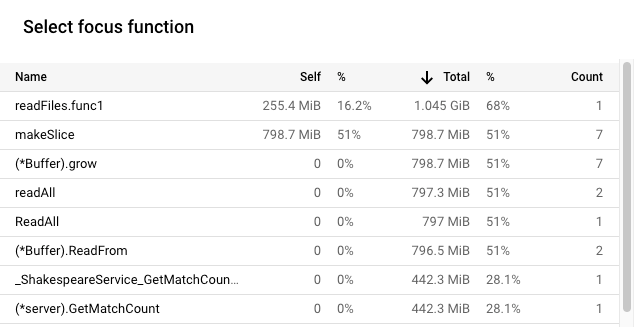
在本範例中,Go 方法 makeSlice 在 10 秒的設定檔收集期間,平均分配了 798.7 MiB。如要減少這些配置,最簡單的方法就是減少對 makeSlice 的呼叫。函式 readFiles 會透過程式庫方法呼叫 makeSlice。
這項分析的結果顯示,最佳化 readFiles 可能有助於降低堆積分配率。
評估變更
如要評估變更,請按照下列步驟操作:
摘要
在本快速入門導覽課程中,我們使用 CPU 時間和已分配堆積設定檔,找出應用程式的潛在最佳化項目。目標是盡可能提高每秒要求數,並消除不必要的分配作業。