Optimize a Go app
In this tutorial, you deploy an intentionally inefficient Go application that is configured to collect profile data. You use the Profiler interface to view the profile data and to identify potential optimizations. You then modify the application, deploy it, and evaluate the effect of the modification.
Before you begin
- Sign in to your Google Cloud account. If you're new to Google Cloud, create an account to evaluate how our products perform in real-world scenarios. New customers also get $300 in free credits to run, test, and deploy workloads.
-
In the Google Cloud console, on the project selector page, select or create a Google Cloud project.
Roles required to select or create a project
- Select a project: Selecting a project doesn't require a specific IAM role—you can select any project that you've been granted a role on.
-
Create a project: To create a project, you need the Project Creator
(
roles/resourcemanager.projectCreator), which contains theresourcemanager.projects.createpermission. Learn how to grant roles.
-
Enable the required API.
Roles required to enable APIs
To enable APIs, you need the Service Usage Admin IAM role (
roles/serviceusage.serviceUsageAdmin), which contains theserviceusage.services.enablepermission. Learn how to grant roles. - To open the Cloud Shell, in the Google Cloud console toolbar, click
Activate Cloud Shell:

After a few moments, a Cloud Shell session opens inside the Google Cloud console:

Sample application
The primary objective is to maximize the number of queries per second that the server can process. A secondary objective is reduce memory usage by eliminating unnecessary memory allocations.
The server, using a gRPC framework, receives a word or phrase, and then returns the number of times the word or phrase appears in the works of Shakespeare.
The average number of queries per second that the server can handle is determined by load testing the server. For each round of tests, a client simulator is called and instructed to issue 20 sequential queries. At the completion of a round, the number of queries sent by the client simulator, the elapsed time, and the average number of queries per second are displayed.
The server code is intentionally inefficient.
Running the sample application
Download and run the sample application:
In the Cloud Shell, run the following commands:
git clone https://github.com/GoogleCloudPlatform/golang-samples.git
cd golang-samples/profiler/shakesapp
Run the application with the version set to
1and the number of rounds set to 15:go run . -version 1 -num_rounds 15After a minute or two, profile data is displayed. The profile data looks similar to the following example:
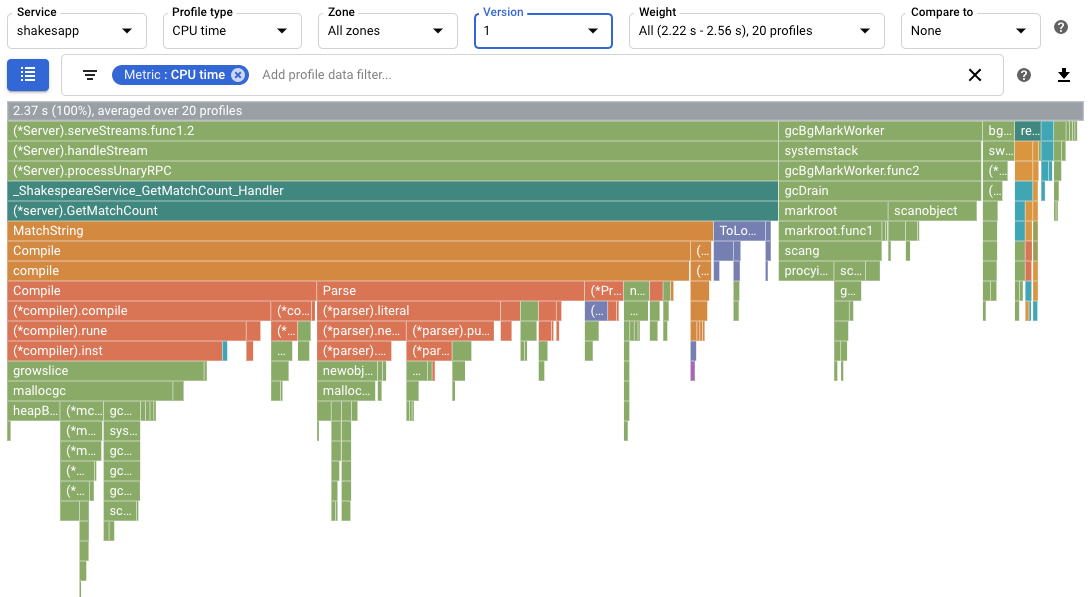
In the screenshot, notice that the Profile type is set to
CPU time. This indicates that CPU usage data is displayed in the flame graph.Sample output printed in the Cloud Shell is shown below:
$ go run . -version 1 -num_rounds 15
2020/08/27 17:27:34 Simulating client requests, round 1
2020/08/27 17:27:34 Stackdriver Profiler Go Agent version: 20200618
2020/08/27 17:27:34 profiler has started
2020/08/27 17:27:34 creating a new profile via profiler service
2020/08/27 17:27:51 Simulated 20 requests in 17.3s, rate of 1.156069 reqs / sec
2020/08/27 17:27:51 Simulating client requests, round 2
2020/08/27 17:28:10 Simulated 20 requests in 19.02s, rate of 1.051525 reqs / sec
2020/08/27 17:28:10 Simulating client requests, round 3
2020/08/27 17:28:29 Simulated 20 requests in 18.71s, rate of 1.068947 reqs / sec
...
2020/08/27 17:44:32 Simulating client requests, round 14
2020/08/27 17:46:04 Simulated 20 requests in 1m32.23s, rate of 0.216849 reqs / sec
2020/08/27 17:46:04 Simulating client requests, round 15
2020/08/27 17:47:52 Simulated 20 requests in 1m48.03s, rate of 0.185134 reqs / sec
The Cloud Shell output displays the elapsed time for each iteration and the average request rate. When the application is started, the entry "Simulated 20 requests in 17.3s, rate of 1.156069 reqs / sec" indicates that the server is executing about 1 request per second. By the last round, the entry "Simulated 20 requests in 1m48.03s, rate of 0.185134 reqs / sec" indicates that the server is executing about 1 request every 5 seconds.
Using CPU time profiles to maximize queries per second
One approach to maximizing the number of queries per second is to identify CPU intensive methods and optimize their implementations. In this section, you use CPU time profiles to identify a CPU intensive method in the server.
Identifying CPU time usage
The root frame of the flame graph lists the total CPU time used by the application over the collection interval of 10 seconds:
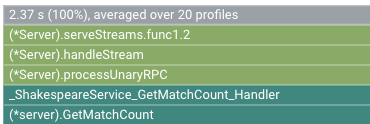
In this example, the service used 2.37 s. When the system runs on a single
core, a CPU time usage of 2.37 seconds corresponds to 23.7% utilization of that
core. For more information, see
Types of profiling available.
Modifying the application
Evaluating the change
To evaluate the change, do the following:
Run the application with the application version set to
2:go run . -version 2 -num_rounds 40A later section shows that with the optimization, the time it takes to execute a single round is much less than that of the unmodified application. To ensure that the application executes long enough to collect and upload profiles, the number of rounds is increased.
Wait for the application to complete, and then view the profile data for this version of the application:
- Click NOW to load the most recent profile data. For more information, see Range of time.
- In the Version menu, select 2.
For one example, the flame graph is as shown:
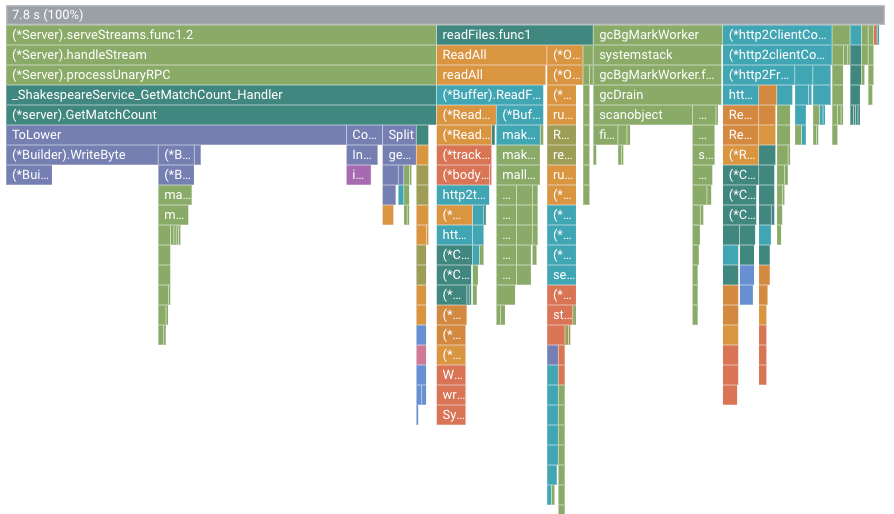
In this figure, the root frame shows a value of 7.8 s. As a result of
changing the string-match function, the CPU time used by the application
increased from 2.37 seconds to 7.8 seconds, or the application went from using
23.7% of a CPU core to using 78% of a CPU core.
The frame width is a proportional measure of the CPU time usage. In this
example, the width of the frame for GetMatchCount indicates that function
uses about 49% of all CPU time used by the application.
In the original flame graph,
this same frame was about 72% of the width of the graph.
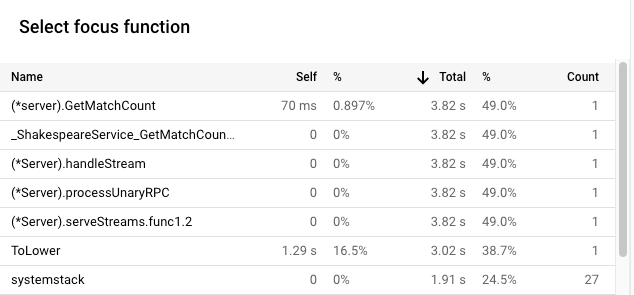
To view the exact CPU time usage, you can use the frame tooltip or you can use
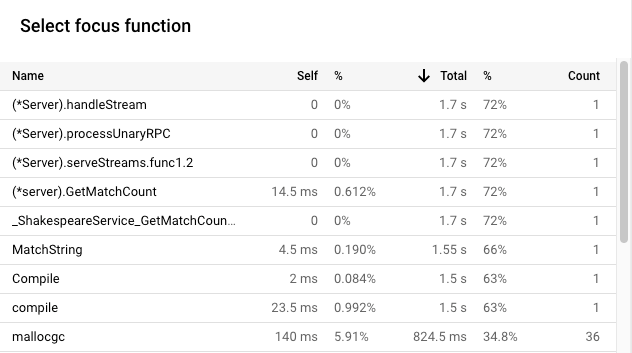
the Focus function list:
The output in the Cloud Shell shows that the modified version is completing about 5.8 requests per second:
$ go run . -version 2 -num_rounds 40
2020/08/27 18:21:40 Simulating client requests, round 1
2020/08/27 18:21:40 Stackdriver Profiler Go Agent version: 20200618
2020/08/27 18:21:40 profiler has started
2020/08/27 18:21:40 creating a new profile via profiler service
2020/08/27 18:21:44 Simulated 20 requests in 3.67s, rate of 5.449591 reqs / sec
2020/08/27 18:21:44 Simulating client requests, round 2
2020/08/27 18:21:47 Simulated 20 requests in 3.72s, rate of 5.376344 reqs / sec
2020/08/27 18:21:47 Simulating client requests, round 3
2020/08/27 18:21:51 Simulated 20 requests in 3.58s, rate of 5.586592 reqs / sec
...
2020/08/27 18:23:51 Simulating client requests, round 39
2020/08/27 18:23:54 Simulated 20 requests in 3.46s, rate of 5.780347 reqs / sec
2020/08/27 18:23:54 Simulating client requests, round 40
2020/08/27 18:23:58 Simulated 20 requests in 3.4s, rate of 5.882353 reqs / sec
The small change to the application had two different effects:
The number of requests per second increased from less than 1 per second to 5.8 per second.
The CPU time per request, computed by dividing the CPU utilization by the the number of requests per second, decreased to 13.4% from 23.7%.
Note that the CPU time per request decreased even though the CPU time usage increased from 2.37 seconds, which corresponds to 23.7% utilization of a single CPU core, to 7.8 seconds, or 78% of a CPU core.
Using allocated heap profiles to improve resource usage
This section illustrates how you can use the heap and allocated heap profiles to identify an allocation-intensive method in the application:
Heap profiles show the amount of memory allocated in the program's heap at the instant the profile is collected.
Allocated heap profiles show the total amount of memory that was allocated in the program's heap during the interval in which the profile was collected. By dividing these values by 10 seconds, the profile collection interval, you can interpret these as allocation rates.
Enabling heap profile collection
Run the application with the application version set to
3and enable the collection of heap and allocated heap profiles.go run . -version 3 -num_rounds 40 -heap -heap_allocWait for the application to complete, and then view the profile data for this version of the application:
- Click NOW to load the most recent profile data.
- In the Version menu, select 3.
- In the Profiler type menu, select Allocated heap.
For one example, the flame graph is as shown:
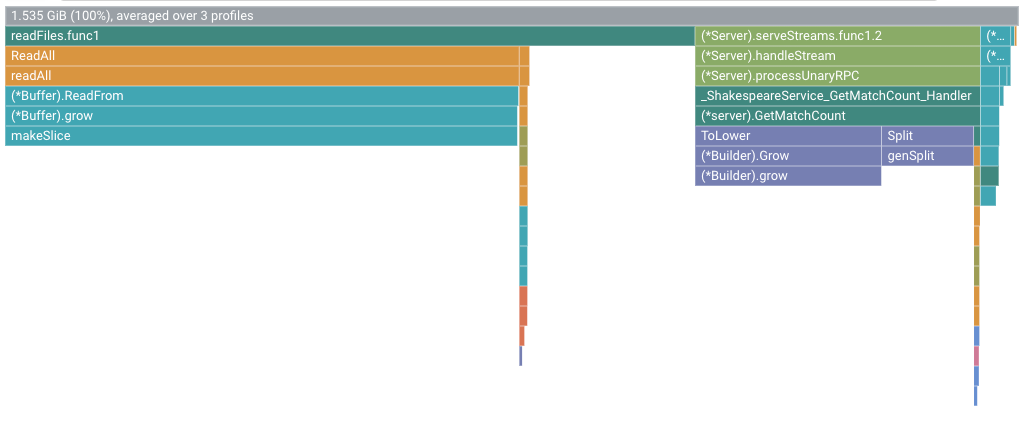
Identifying the heap allocation rate
The root frame displays the total amount of heap that was allocated during the 10 seconds when a profile was collected, averaged over all profiles. In this example, the root frame shows that, on average, 1.535 GiB of memory was allocated.
Modifying the application
Evaluating the change
To evaluate the change, do the following:
Run the application with the application version set to
4:go run . -version 4 -num_rounds 60 -heap -heap_allocWait for the application to complete, and then view the profile data for this version of the application:
- Click NOW to load the most recent profile data.
- In the Version menu, select 4.
- In the Profiler type menu, select Allocated heap.
To quantify the effect of changing
readFileson the heap allocation rate, compare the allocated heap profiles for version 4 to those collected for 3: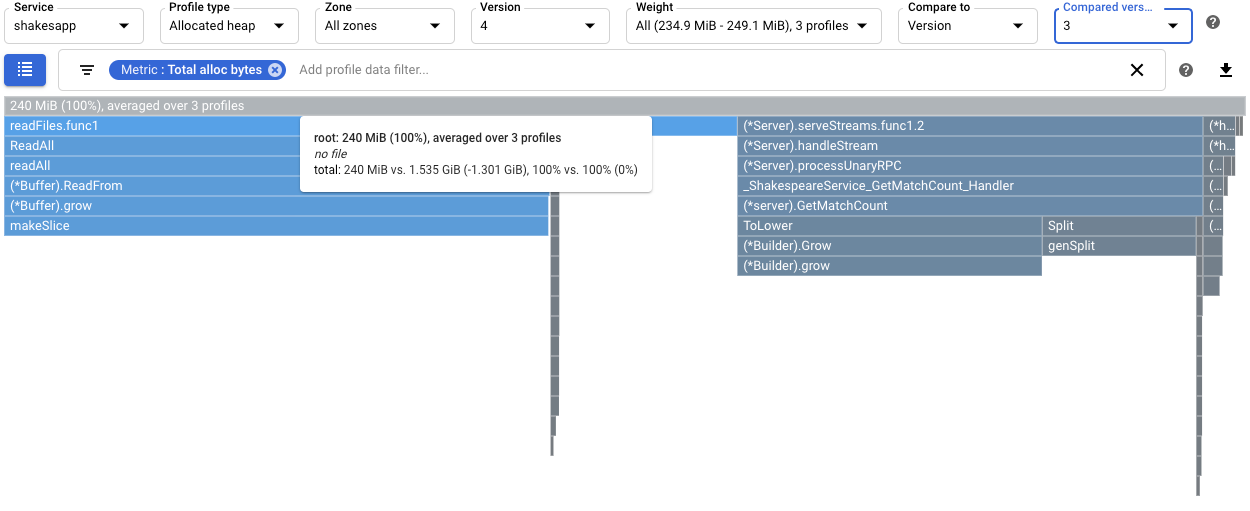
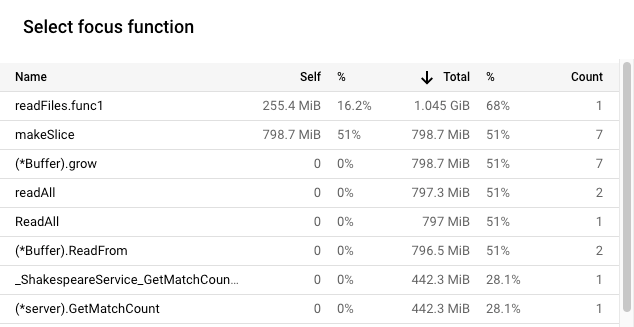
The root frame's tooltip shows that with version 4, the average amount of memory allocated during profile collection decreased by 1.301 GiB, as compared to version 3. The tooltip for
readFiles.func1shows a decrease of 1.045 GiB:
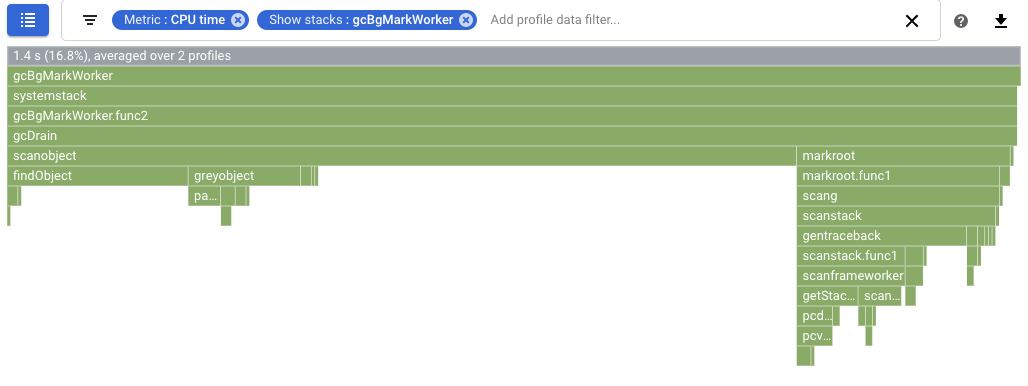
To quantify the effect on garbage collection, configure a comparison of CPU time profiles. In the following screenshot, a filter is applied to show the the stacks for the Go garbage collector
runtime.gcBgMarkWorker.*. The screenshot shows that the CPU usage for garbage collection is reduced to 4.97% from 16.8%.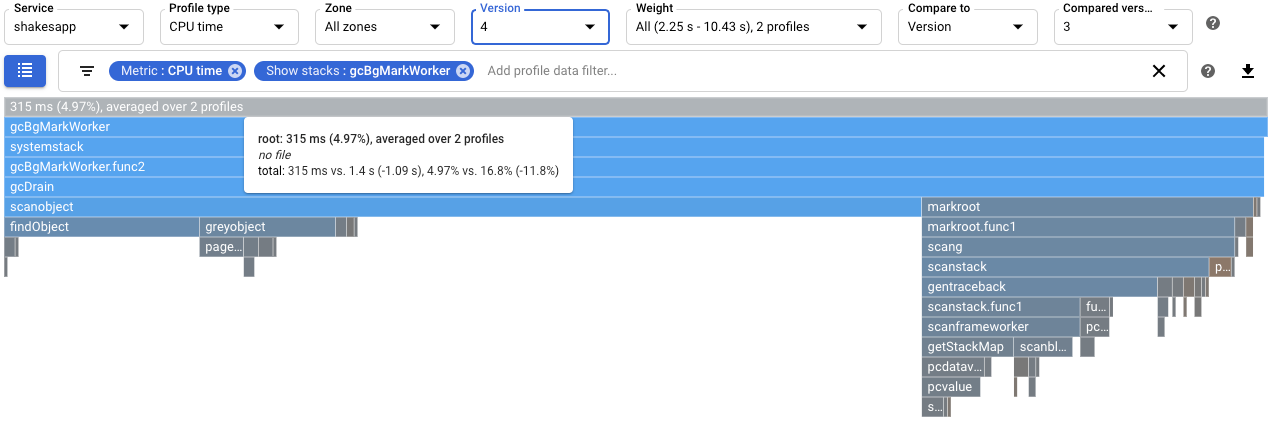
To determine if there is an impact of the change on the number of requests per second handled by the application, view the output in the Cloud Shell. In this example, version 4 completes up to 15 requests per second, which is substantially higher than the 5.8 requests per second of version 3:
$ go run . -version 4 -num_rounds 60 -heap -heap_alloc
2020/08/27 21:51:42 Simulating client requests, round 1
2020/08/27 21:51:42 Stackdriver Profiler Go Agent version: 20200618
2020/08/27 21:51:42 profiler has started
2020/08/27 21:51:42 creating a new profile via profiler service
2020/08/27 21:51:44 Simulated 20 requests in 1.47s, rate of 13.605442 reqs / sec
2020/08/27 21:51:44 Simulating client requests, round 2
2020/08/27 21:51:45 Simulated 20 requests in 1.3s, rate of 15.384615 reqs / sec
2020/08/27 21:51:45 Simulating client requests, round 3
2020/08/27 21:51:46 Simulated 20 requests in 1.31s, rate of 15.267176 reqs / sec
...
The increase in queries per second served by the application might be due to less time being spent on garbage collection.
You can get a more complete understanding of the effect of the modification to
readFilesby viewing the heap profiles. A comparison of heap profiles for version 4 to that of version 3 shows that the heap usage decreased to 18.47 MiB from 70.95 MiB:
Summary
In this quickstart, CPU time and allocated heap profiles were used to identify potential optimizations to an application. The goals were to maximize the number of requests per second and to eliminate unnecessary allocations.
By using CPU time profiles, a CPU intensive function was identified. After applying a simple change, the server's request rate increased to 5.8 per second, up from about 1 per second.
By using allocated heap profiles, the
shakesapp/server.gofunctionreadFileswas identified as having a high allocation rate. After optimizingreadFiles, the server's request rate increased to 15 requests per second and the average amount of memory allocated during the 10 second profile collection decreased by 1.301 GiB.
What's next
For information on how profiles are collected and sent to your Google Cloud project, see Profile collection.
Read our resources about DevOps and explore our research program.
- Profiling Go applications
- Profiling Java applications
- Profiling Node.js applications
- Profiling Python applications
- Profiling applications running outside Google Cloud

