Sign in to your Google Cloud account. If you're new to
Google Cloud,
create an account to evaluate how our products perform in
real-world scenarios. New customers also get $300 in free credits to
run, test, and deploy workloads.
In the Google Cloud console, on the project selector page,
select or create a Google Cloud project.
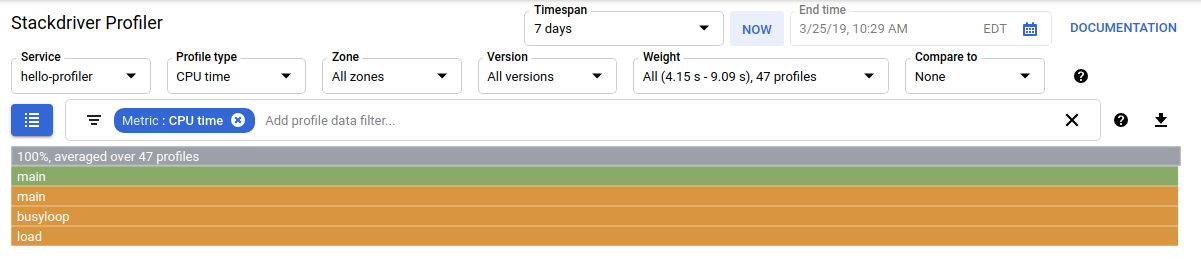
애플리케이션을 시작하고 잠시 후에 초기 프로필 데이터가 Profiler에 표시됩니다. 이 인터페이스는 프로파일링 데이터를 탐색하는 데 필요한 컨트롤 배열과 Flame 그래프를 제공합니다.
시간 컨트롤 외에도 사용할 프로필 데이터 집합을 선택할 수 있는 옵션이 있습니다. 여러 애플리케이션을 프로파일링할 경우, 서비스를 사용하여 프로파일링 대상 데이터의 원본을 선택합니다.
프로필 유형은 표시할 프로필 데이터의 종류를 선택하는 데 사용됩니다. 영역 이름과 버전은 Compute Engine 영역 또는 애플리케이션 버전의 데이터 표시를 제한하는 데 사용됩니다. 가중치는 리소스 사용이 가장 많은 기간 중에 캡처된 프로필을 선택하는 데 사용됩니다.
필터를 추가하면 Flame 그래프에 분석할 프로필이 표시되는 방식을 세분화할 수 있습니다. 앞의 스크린샷에서는 필터 표시줄 filter_list에 필터 한 개가 있습니다. 이 필터 옵션은 Metric이고 필터 값은 CPU time입니다.
데이터 탐색
Flame 그래프에는 프로그램의 호출 스택이 표시됩니다. Flame 그래프에는 각 함수가 프레임으로 표시됩니다.
프레임 너비는 함수의 리소스 소비율을 나타냅니다.
상단 프레임은 전체 프로그램을 나타냅니다. 이 프레임에는 리소스 소비율이 항상 100%로 표시됩니다. 또한 이 프레임에는 이 그래프에서 평균을 구하는 데 사용된 프로필 수가 나와 있습니다.
샘플 프로그램에는 복잡한 호출 스택 집합이 없습니다. 앞의 스크린샷에는 5개의 프레임이 있습니다.
회색 프레임은 리소스 소비율 100%를 차지하는 전체 실행 파일을 나타냅니다.
녹색 main 프레임은 Go runtime.main입니다.
주황색 main 프레임은 샘플 프로그램의 main 루틴입니다.
주황색 busyloop 프레임은 샘플의 main에서 호출되는 루틴입니다.
주황색 main.load 프레임은 샘플의 main에서 호출되는 루틴입니다.
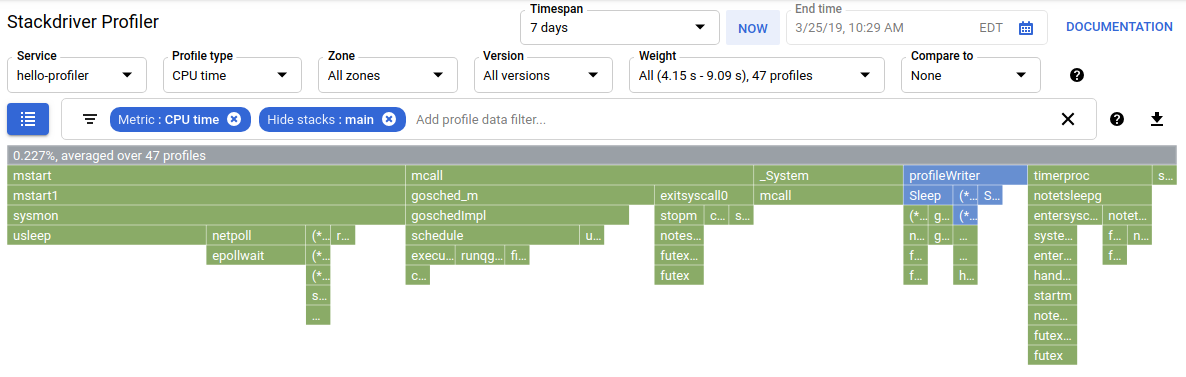
필터 선택기를 사용하면 일부 이름과 일치하는 함수를 필터링하는 등의 작업을 수행할 수 있습니다. 예를 들어 유틸리티 함수의 표준 라이브러리가 있는 경우 이를 그래프에서 삭제할 수 있습니다. 특정 메서드에서 시작된 호출 스택을 삭제하거나 다른 방식으로 그래프를 단순화할 수도 있습니다.
main.go 애플리케이션은 단순하므로 필터링할 필요가 없습니다.
간단한 애플리케이션이라도 필터를 사용하면 관심 없는 프레임을 숨겨 원하는 프레임을 보다 명확하게 볼 수 있습니다. 예를 들어 샘플 코드의 프로파일링 스크린샷에서 회색 프레임은 그 아래에 있는 첫 번째 main 프레임보다 약간 큽니다. 왜일까요? 이와 같은 main 호출 스택의 압도적인 리소스 소비율로 인해 즉각적으로 확인할 수 없는 다른 상황이 있는 것일까요?
애플리케이션의 main 루틴 외부에서 발생하는 소비를 보려면 main 루틴의 호출 스택을 숨기는 필터를 추가합니다.
리소스 소비의 0.227%만 main 외부에서 발생합니다.
필터링 및 기타 프로파일링 데이터 탐색 방법에 대한 자세한 내용은 분석할 프로필 선택을 참조하세요.
[[["이해하기 쉬움","easyToUnderstand","thumb-up"],["문제가 해결됨","solvedMyProblem","thumb-up"],["기타","otherUp","thumb-up"]],[["이해하기 어려움","hardToUnderstand","thumb-down"],["잘못된 정보 또는 샘플 코드","incorrectInformationOrSampleCode","thumb-down"],["필요한 정보/샘플이 없음","missingTheInformationSamplesINeed","thumb-down"],["번역 문제","translationIssue","thumb-down"],["기타","otherDown","thumb-down"]],["최종 업데이트: 2025-09-04(UTC)"],[],[],null,["# Quickstart: Measure app performance\n\nMeasure app performance\n=======================\n\nThis document shows you how to set up and use Cloud Profiler. You use\nthe Cloud Shell to\ndownload a sample Go program, run it with profiling enabled, and then\nuse the Profiler interface to explore the captured data.\n\nIf you plan to profile applications that are running outside of\nGoogle Cloud, then you need to perform some configuration steps that aren't\ndiscussed in this document. For information about these steps, see\n[Profiling applications running outside Google Cloud](/profiler/docs/profiling-external).\n\nBefore you begin\n----------------\n\n- Sign in to your Google Cloud account. If you're new to Google Cloud, [create an account](https://console.cloud.google.com/freetrial) to evaluate how our products perform in real-world scenarios. New customers also get $300 in free credits to run, test, and deploy workloads.\n- In the Google Cloud console, on the project selector page,\n select or create a Google Cloud project.\n\n | **Note**: If you don't plan to keep the resources that you create in this procedure, create a project instead of selecting an existing project. After you finish these steps, you can delete the project, removing all resources associated with the project.\n\n [Go to project selector](https://console.cloud.google.com/projectselector2/home/dashboard)\n-\n\n\n Enable the required API.\n\n\n [Enable the API](https://console.cloud.google.com/flows/enableapi?apiid=cloudprofiler.googleapis.com&redirect=https://console.cloud.google.com)\n\n- In the Google Cloud console, on the project selector page,\n select or create a Google Cloud project.\n\n | **Note**: If you don't plan to keep the resources that you create in this procedure, create a project instead of selecting an existing project. After you finish these steps, you can delete the project, removing all resources associated with the project.\n\n [Go to project selector](https://console.cloud.google.com/projectselector2/home/dashboard)\n-\n\n\n Enable the required API.\n\n\n [Enable the API](https://console.cloud.google.com/flows/enableapi?apiid=cloudprofiler.googleapis.com&redirect=https://console.cloud.google.com)\n\n1. \n2.\n\n\n Enable the required API.\n\n\n [Enable the API](https://console.cloud.google.com/flows/enableapi?apiid=cloudprofiler.googleapis.com&redirect=https://console.cloud.google.com)\n3. To open the Cloud Shell, in the Google Cloud console toolbar, click **Activate Cloud Shell** :\n\n \u003cbr /\u003e\n\n After a few moments, a Cloud Shell session opens inside the\n Google Cloud console:\n\n\u003cbr /\u003e\n\nGet a program to profile\n------------------------\n\nThe sample program, `main.go`, is in the `golang-samples` repository on\nGitHub. To get it, in the Cloud Shell, run the following command\nto retrieve the package of Go samples: \n\n git clone https://github.com/GoogleCloudPlatform/golang-samples.git\n\nThe package retrieval takes a few moments to complete.\n\nProfile the code\n----------------\n\nIn the Cloud Shell, go\nto the directory of sample code for Profiler in the retrieved\npackage: \n\n cd golang-samples/profiler/profiler_quickstart\n\nThe `main.go` program creates a CPU-intensive workload to provide data to\nthe profiler. In the Cloud Shell, run the following command to\nstart the program, and leave it running: \n\n go run main.go\n\nThis program is designed to load the CPU as it runs. It is configured\nto use Profiler, which collects profiling data from the program\nas it runs and periodically saves it.\n\nA few seconds after you start the program, you see the message\n`profiler has started`. In about a minute, two more messages are displayed: \n\n successfully created profile CPU\n start uploading profile\n\nThese messages indicate that a profile was created and uploaded to your\nCloud Storage project. The program continues to emit the last two messages,\nabout one time per minute, for as long as it runs.\n\nIf you receive a permission denied error message after starting the service,\nsee\n[Errors with your Google Cloud project configuration](/profiler/docs/troubleshooting#errors-configuration).\n\nProfiler interface\n------------------\n\nA few moments after you start the application, Profiler\ndisplays the initial profile data. The interface offers an array of controls\nand a flame graph for exploring the profiling data:\n\nIn addition to time controls, there are options that let you choose the set\nof profile data to use. When you are profiling multiple applications, you use\n**Service** to select the origin of the profiled data.\n**Profile type** lets you choose the kind\nof profile data to display. **Zone name** and **Version** let you restrict\ndisplay to data from [Compute Engine zones](/compute/docs/regions-zones) or versions of\nthe application. **Weight** lets you select profiles captured during peak\nresource consumption.\n\nTo refine how the flame graph displays the profiles you've selected to analyze,\nyou add filters. In the previous screenshot, the filter bar\n*filter_list* shows\none filter. This filter option is `Metric` and the filter value is `CPU time`.\n\n### Exploring the data\n\nThe flame graph displays the call stacks of the program. The flame graph\nrepresents each function with a frame.\nThe width of the frame represents the proportion of resource consumption\nby that function.\nThe top frame represents the entire program. This frame always shows 100%\nof the resource consumption. This frame also lists how many profiles are\naveraged together in this graph.\n\nThe sample program doesn't have a complicated set of call stacks;\nin the preceding screenshot, you see 5 frames:\n\n- The gray frame represents the entire executable, which accounts for 100% of the resources being consumed.\n- The green `main` frame is the Go `runtime.main`.\n- The orange `main` frame is the `main` routine of the sample program.\n- The orange `busyloop` frame is a routine called from the sample's `main`.\n- The orange `main.load` frame is a routine called from the sample's `main`.\n\nThe filter selector lets you do things like filter out functions that match\nsome name. For example, if there is a standard library of utility functions,\nyou can remove them from the graph. You can also remove call stacks\noriginating at a certain method or simplify the graph in other ways.\nThe `main.go` application is simple, so there isn't much to\nfilter out.\n\nEven for a simple application, filters let you hide uninteresting frames so\nthat you can more clearly view interesting frames. For example, in the\nprofiling screenshot for the sample code, the gray frame is slightly\nlarger than the first `main` frame under it. Why? Is there something else\ngoing on that's not immediately apparent because the `main` call stack\nconsumes such an overwhelming percentage of the resources?\nTo view what is occurring outside of the application's `main` routine,\nadd a filter that hides the call stack of the `main` routine.\nOnly 0.227% of the resource consumption occurs outside of `main`:\n\nFor more information on filtering and other ways to explore the profiling\ndata, see [Select the profiles to analyze](/profiler/docs/selecting-profiles).\n| **Note:** If the Profiler agent hasn't uploaded any profiles when you start the interface, Profiler displays the message `No data to show`. The message is automatically replaced with the Profiler interface after profile data is available.\n\nWhat's next\n-----------\n\nFor general information about profiling, see the following documents:\n\n- [Cloud Profiler overview](/profiler/docs/about-profiler)\n- [Profiling concepts](/profiler/docs/concepts-profiling)\n- Read our resources about [DevOps](/devops) and explore [DORA's research program](https://www.devops-research.com/research.html).\n\nFor information on running the Cloud Profiler agent, see:\n\n\u003c!-- --\u003e\n\n- [Profiling Go applications](/profiler/docs/profiling-go)\n- [Profiling Java applications](/profiler/docs/profiling-java)\n- [Profiling Node.js applications](/profiler/docs/profiling-nodejs)\n- [Profiling Python applications](/profiler/docs/profiling-python)\n- [Profiling applications running outside Google Cloud](/profiler/docs/profiling-external)"]]