To help you determine what is taking place when running jobs against your waves, Migrate for Compute Engine provides two ways to monitor your progress: monitoring wave status and viewing logs.
Monitoring wave status
The Last Job (Status) column on the Waves screen indicates the phase and status of the wave. This screen updates every five seconds.
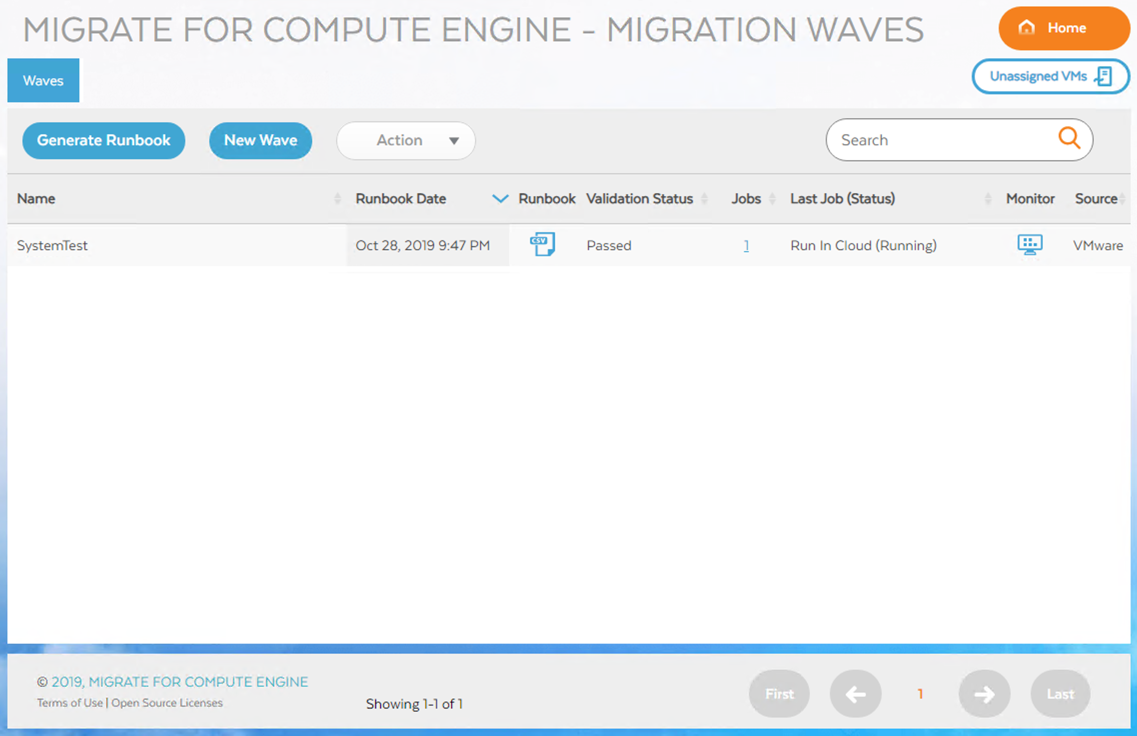
To monitor the live status of the VMs in a wave, click the icon in the Monitor column of that wave.
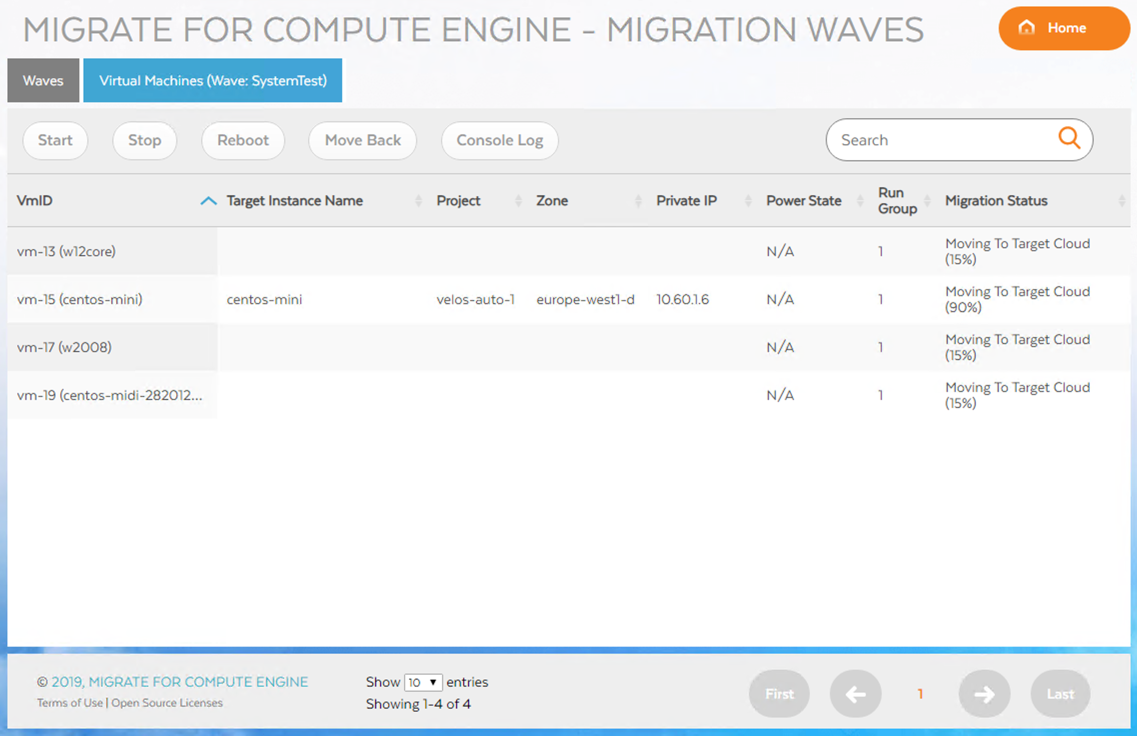
Each row represents a VM that is part of the wave and describes that VM's status. You can select a row and then perform a Start, Stop, or Reboot. Note that you can hover your mouse over values in the Migration Status column for more detailed information, such as the current substep within the step shown in the column.
Viewing a wave's history
To view the history of all jobs run on a wave, click in the Jobs column of the desired wave. On the Jobs screen, you can see the job history for that wave and whether it's currently running.
Viewing job status details
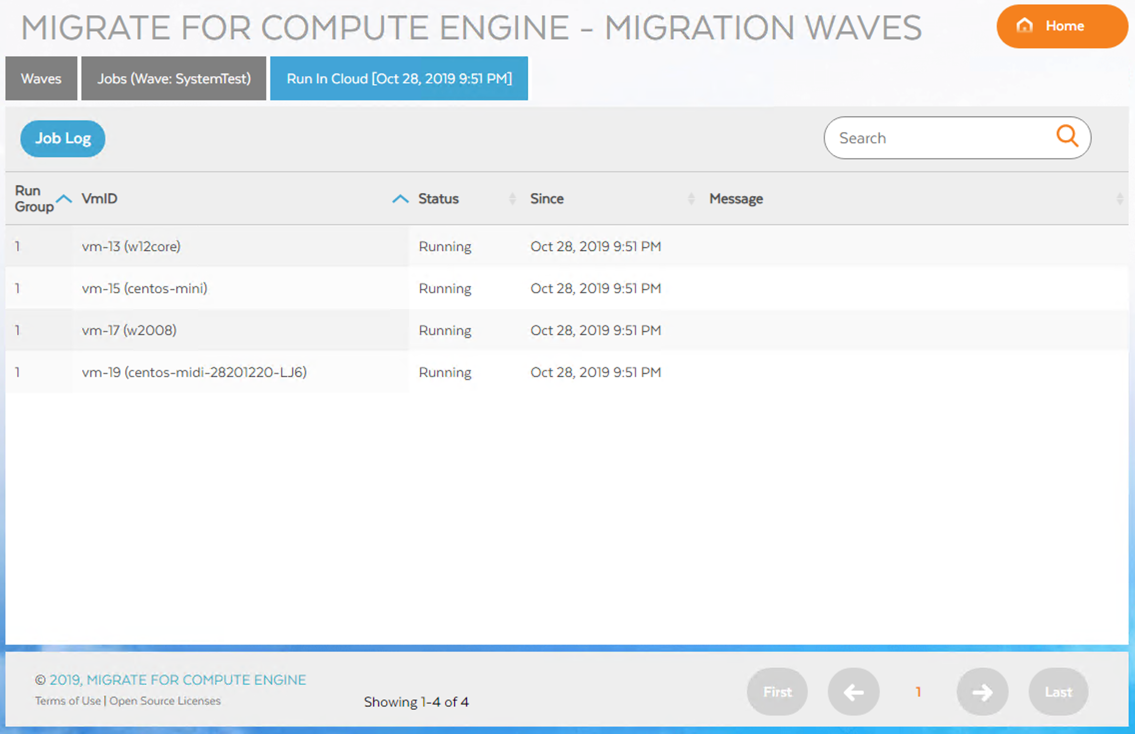
To view status of specific job details, click the Status column cell on the relevant job status link to see the list of VMs in the job and their status.
Viewing job log details
To view the log for a job, click the eye icon in that job's row. Viewing the log gives detailed insight into exactly what is taking place.
You can simplify scanning the log by collapsing unneeded sections, or you can click the Details icon to see more information
View job task logs
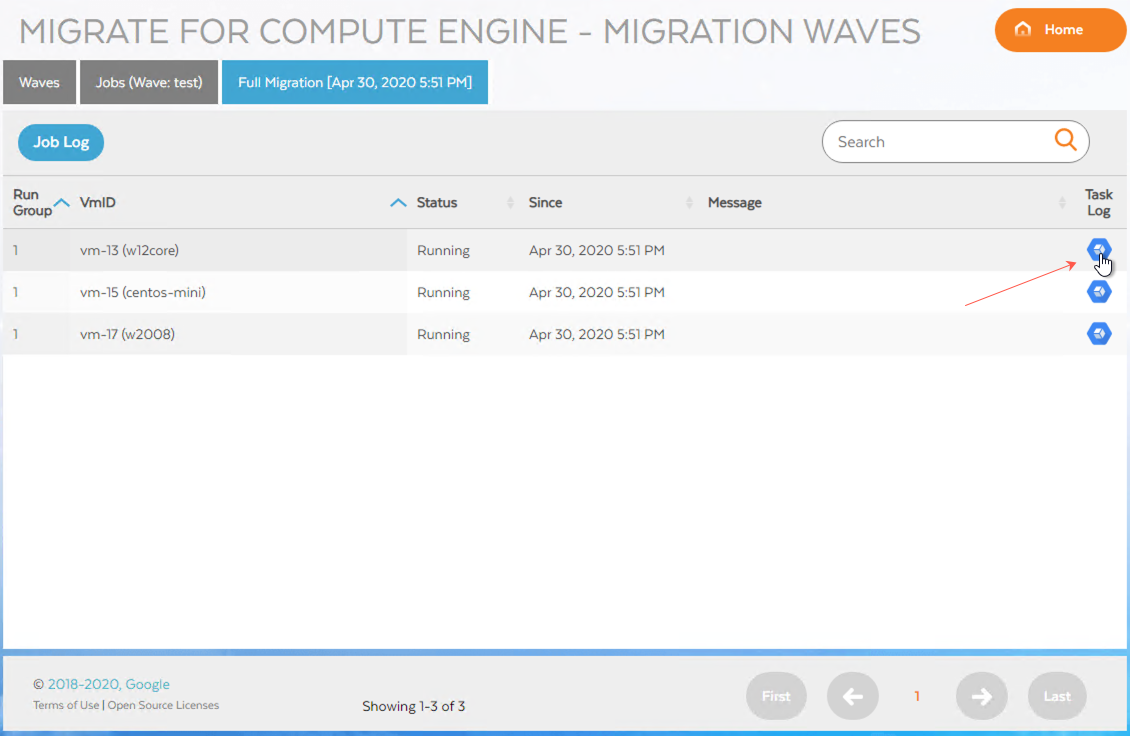
To view the log for a specific VM task in a job, click the icon in the task's Task Log column. The link will navigate you to the Cloud Logging logs for the task.
The icon will be unavailable to click if the task has not started, such as due to an error.