Import datasets into Dataprep by Trifacta
This page shows you how to get started using the Dataprep Web application.
Before you begin
Set up a project
- Sign in to your Google Cloud account. If you're new to Google Cloud, create an account to evaluate how our products perform in real-world scenarios. New customers also get $300 in free credits to run, test, and deploy workloads.
-
In the Google Cloud console, on the project selector page, select or create a Google Cloud project.
-
Make sure that billing is enabled for your Google Cloud project.
-
Enable the Cloud Dataflow, BigQuery, and Cloud Storage APIs.
-
In the Google Cloud console, on the project selector page, select or create a Google Cloud project.
-
Make sure that billing is enabled for your Google Cloud project.
-
Enable the Cloud Dataflow, BigQuery, and Cloud Storage APIs.
Create a Cloud Storage bucket in your project
- In the Google Cloud console, go to the Cloud Storage Buckets page.
- Click Create bucket.
- On the Create a bucket page, enter your bucket information. To go to the next
step, click Continue.
- For Name your bucket, enter a name that meets the bucket naming requirements.
-
For Choose where to store your data, do the following:
- Select a Location type option.
- Select a Location option.
- For Choose a default storage class for your data, select a storage class.
- For Choose how to control access to objects, select an Access control option.
- For Advanced settings (optional), specify an encryption method, a retention policy, or bucket labels.
- Click Create.
Set up Dataprep
Open Dataprep on Google Cloud console. When you first open Dataprep, the project owner is asked to allow data access by Google and Trifacta. The user must accept the terms of service, sign in to their Google account, and choose a Cloud Storage bucket to use with Dataprep (see Enabling Dataprep).
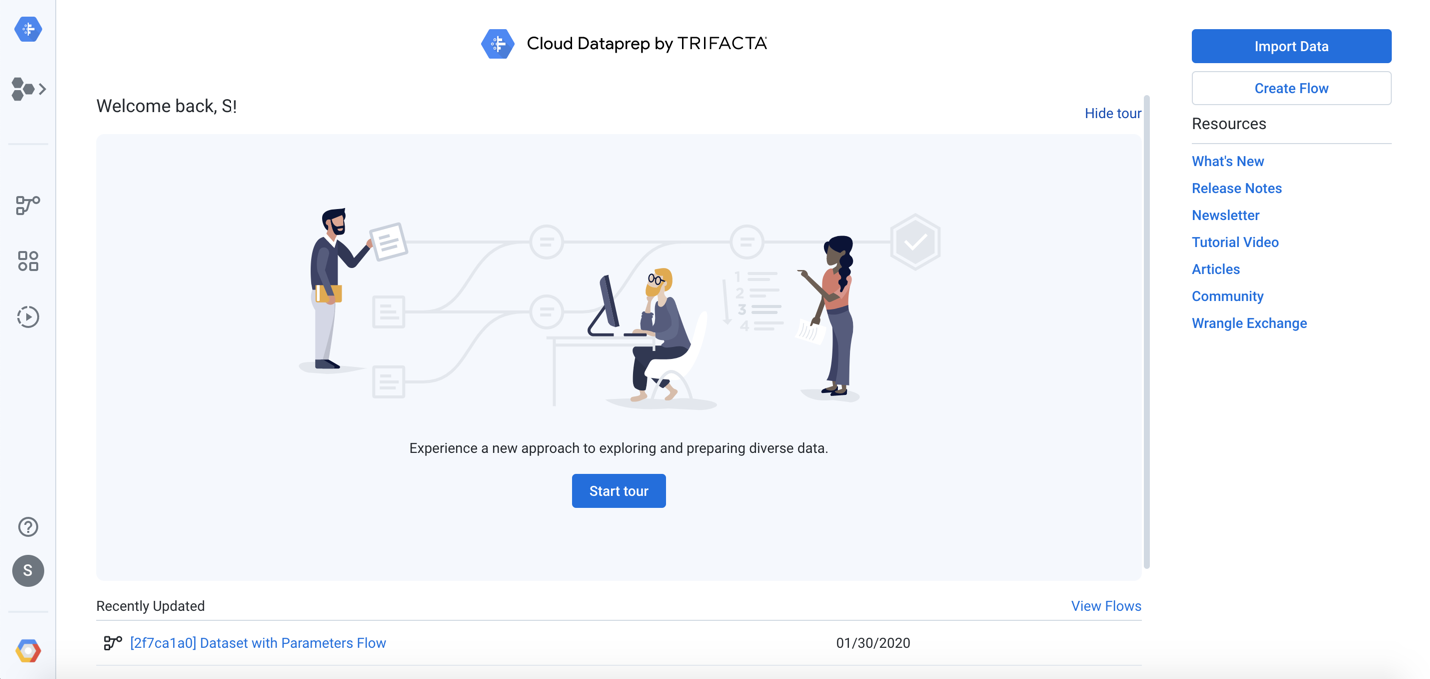
After completing these steps, the Dataprep home page appears. You can choose to
Show the tour and run it, which walks you through steps that
parallel the steps in this quickstart.
Create a flow
Dataprep uses a container object called a flow to
access and manipulate datasets. From the Dataprep home page, click
the Flows icon ![]() in
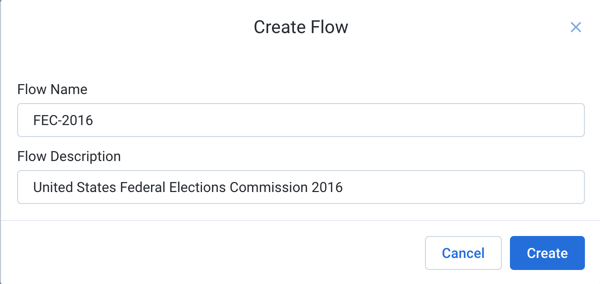
the left nav bar. Then, click Create. Select Create Flow. Fill in a flow name and description,
then click Create.
Since this quickstart uses 2016 data from the
United States Federal Elections Commission,
you may wish to name it, "FEC-2016", with a description that refers to this data.
in
the left nav bar. Then, click Create. Select Create Flow. Fill in a flow name and description,
then click Create.
Since this quickstart uses 2016 data from the
United States Federal Elections Commission,
you may wish to name it, "FEC-2016", with a description that refers to this data.
The Flow View page opens.
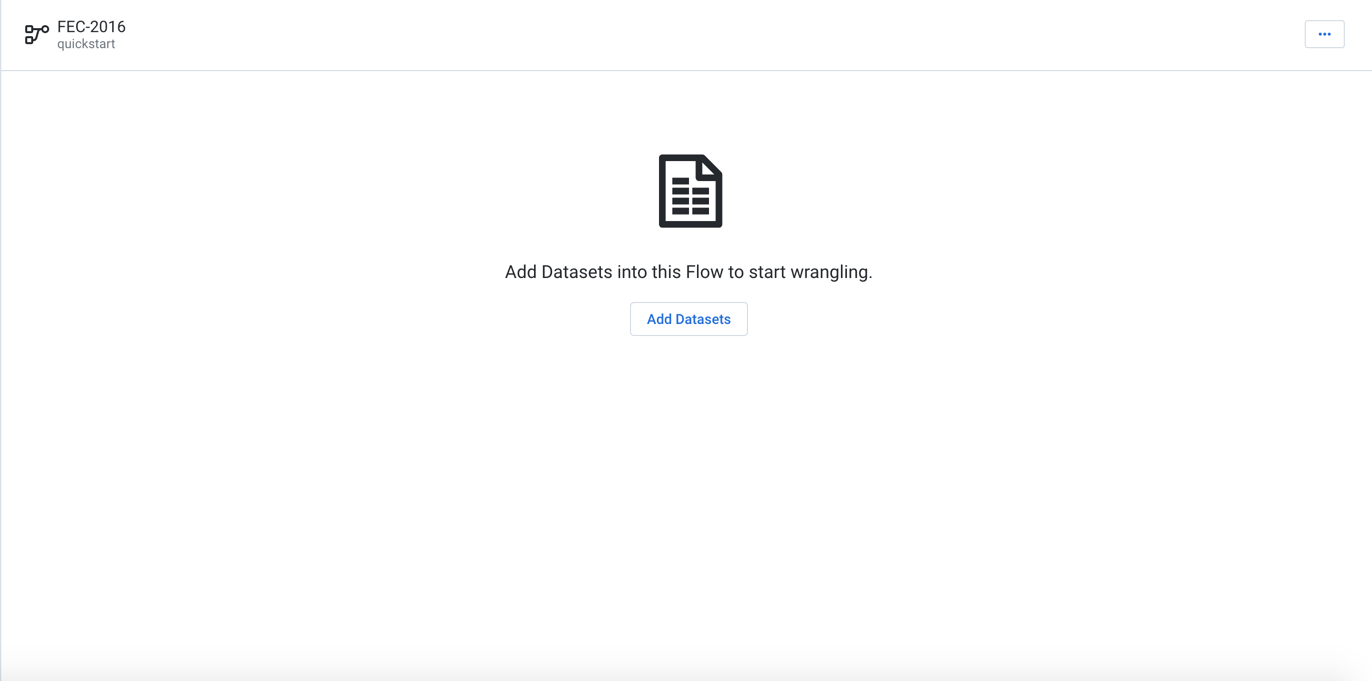
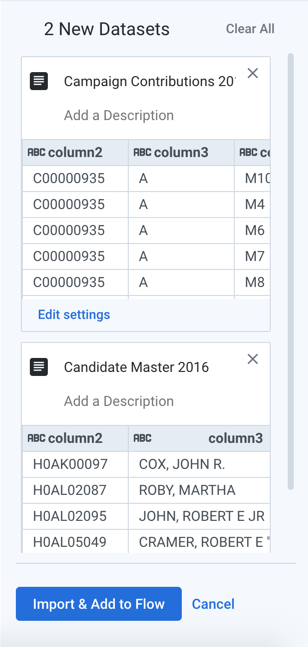
Import datasets
From Flow View, click Add Datasets to open the Add Datasets to Flow page.
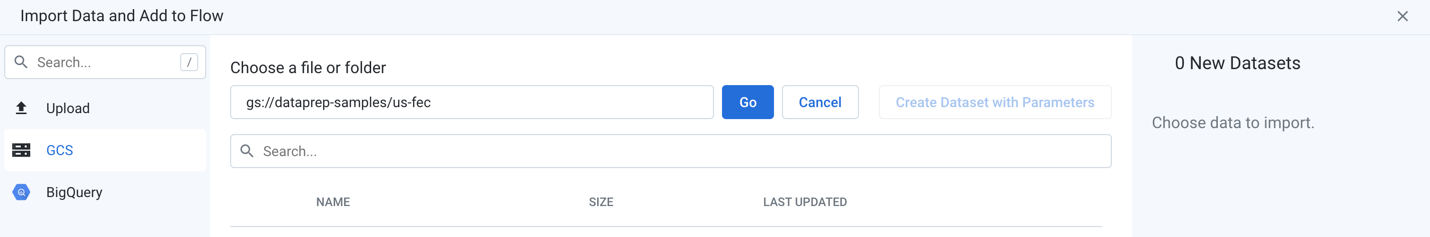
Click Import Datasets. Select GCS in the left panel. Under Choose a
file or folder, click the Pencil icon, then insert
gs://dataprep-samples/us-fec in the GCS text box. Click Go.
Select the cn-2016.txt dataset. Name it "Candidate Master 2016" in the right
panel. Then select the itcont-2016.txt dataset, naming it "Campaign Contributions
2016". After both datasets are listed and renamed in the right panel, click
Import & Add to Flow to add the datasets.
Wrangle the Candidate file
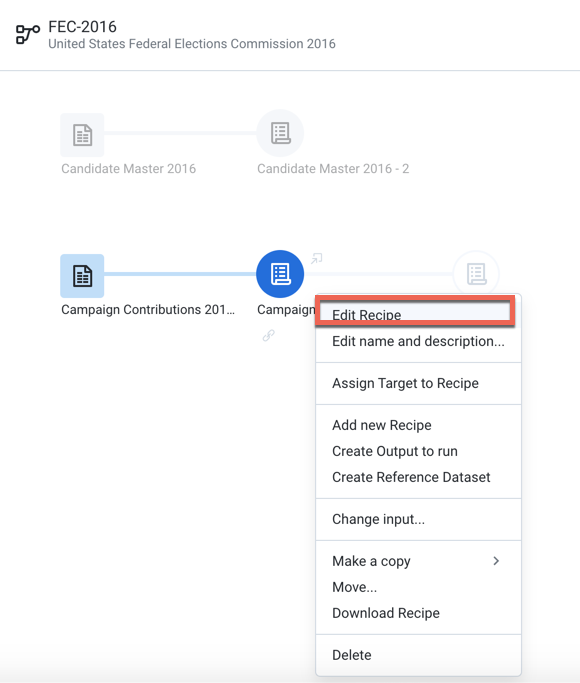
On the FEC 2016 Flow page, select the Candidate Master 2016 dataset, then click Add New Recipe.
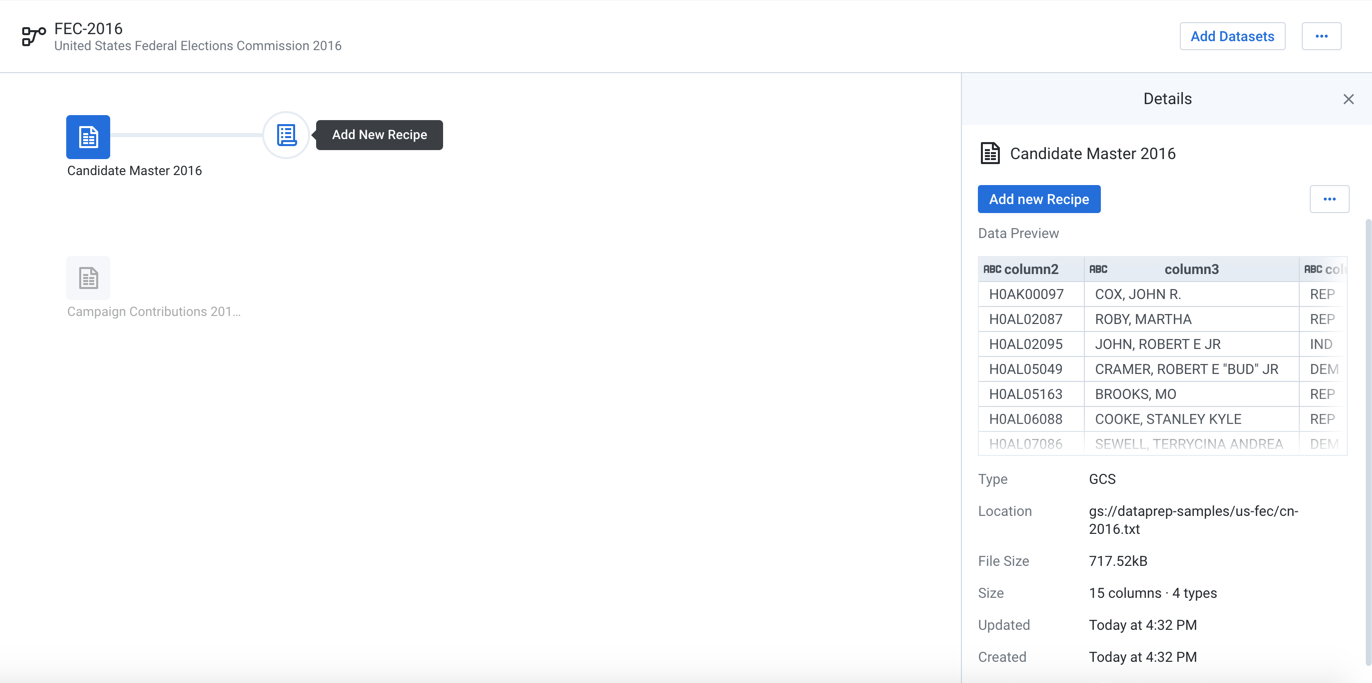
A new recipe icon appears. Click Edit Recipe.
The Transformer page opens, where you can explore a sample of your data and build your recipe by applying transformation steps to it.
To Display the Recipe pane: A recipe is created n the Recipe pane. If the
Recipe pane is not displayed on the right side of the page, click the Recipe
icon at the top-right of the Grid view page.![]()
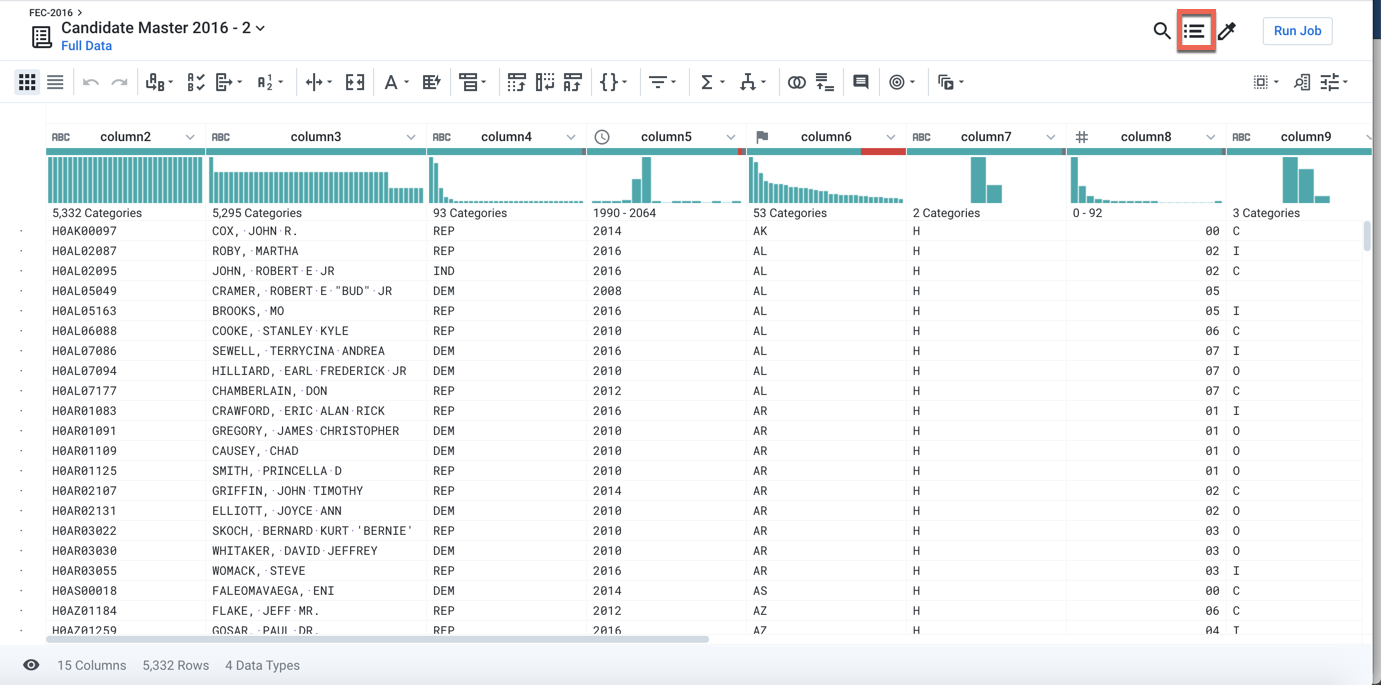
column5 (Date/Time) contains a year value. Select the years 2016 and 2017
in the histogram by dragging across them.
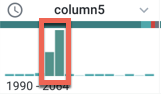
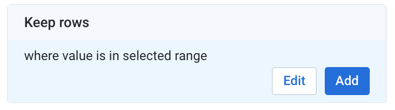
In the right panel, you should see a suggestion card titled "Keep rows where value is in selected range". Click Add.
The following recipe step is added to the recipe:
Keep rows where(date(2016, 1, 1) <= column5) && (column5 < date(2018, 1, 1))
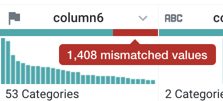
In the column6 (State) header, hover over and click the mismatched (red) bar
to select the mismatched rows.
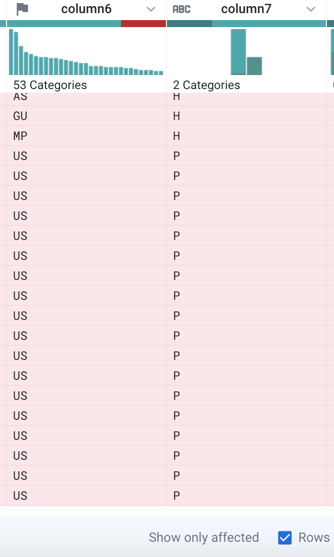
In the Status bar at the bottom of the page, select the Show only affected checkbox. Notice that some the red highlighted (mismatched) items have the value "US" in column6 and "P" in column7. These are presidential candidates. The mismatch occurs because column6 is marked as a "State" column (indicated by the flag icon), but it also includes non-state (such as "US") values.
To correct the mismatch, click the X in the right panel to cancel the transformation. The column must be re-typed as a column of String data type. Click the flag icon above column6 and select "String".
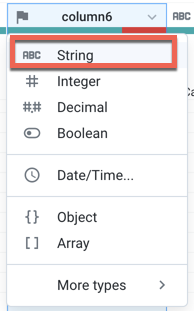
The column's data type is changed to String. String data type matches with any non-empty value in a column, which means that the mismatch is removed. The data quality bar is now completely green.
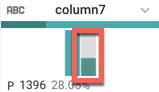
Now, let's filter on just the presidential candidates. In the histogram for column7, click the "P" bin.
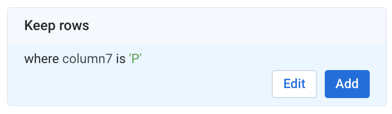
In the right panel, you should see a suggestion card titled "Keep rows where column7 is 'P'":. Click Add.
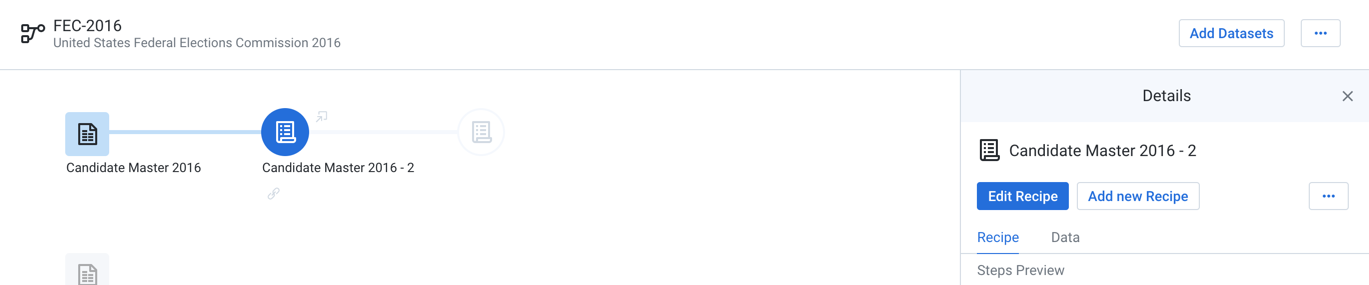
Wrangle the Contributions file and join it in
In the Transformer page, click FEC 2016 in the upper left corner of the Flow View page. Select Campaign Contributions 2016, then select Add new Recipe, then click Edit Recipe to open a sample of the contributions dataset back in the Transformer page.
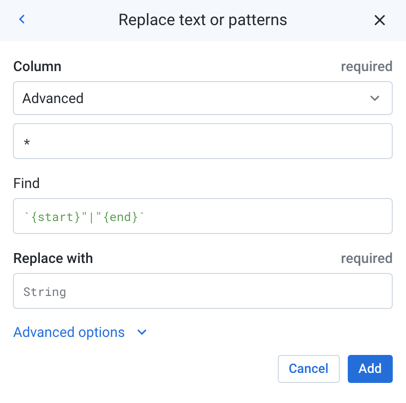
In the Transformer page, open the Recipe panel. You can add a new step to the recipe that removes extra delimiters from the contributions dataset. Open the Recipe panel. Copy and paste the following Wrangle language command in the Search box.
replacepatterns col: * with: '' on: `{start}"|"{end}` global: true
The Transformation Builder parses the Wrangle command and populates the fields
for the Replace text or patterns transformation. Click Add to add the
transformation to the recipe.
Joins: Let's join this dataset to the first one. Add another new step to the
recipe, then type "Join" in the Search box.
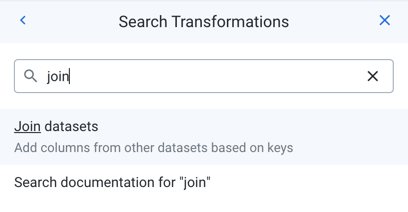
Click the "Join datasets" link to open the Joins page.
In the Recipes in the current
flow tab, select Candidate Master 2016-2
(the Candidate Master dataset with the Recipe steps added above).
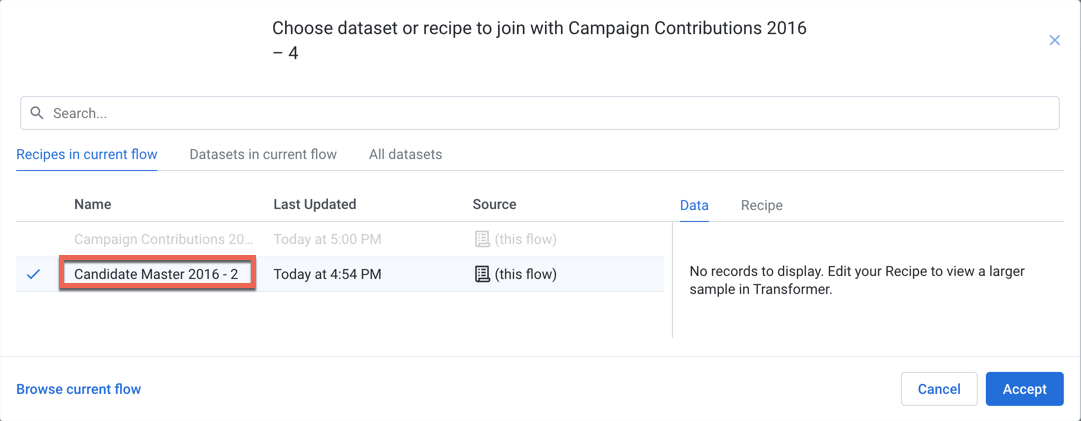
Click Accept.
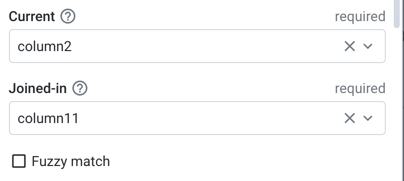
In the Join window, you specify the keys and conditions of the join
transformation. Cloud Dataprep infers some of these details for you. In this
case, the join type (inner) is correct, but the join keys are not. Hover over
them and click the Pencil icon. Select Current = column 2 and
Joined-in = column 11 as the join keys.
Click Save and Continue. Click Next. In the Join - Output Columns window, select the checkbox immediately under the "All (36)" label, which adds all columns of both datasets to the joined dataset:
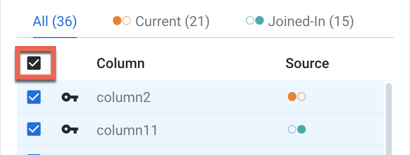
Then click Review. If all looks good, click Add to Recipe. In the Transformer page, the join transformation has been applied.
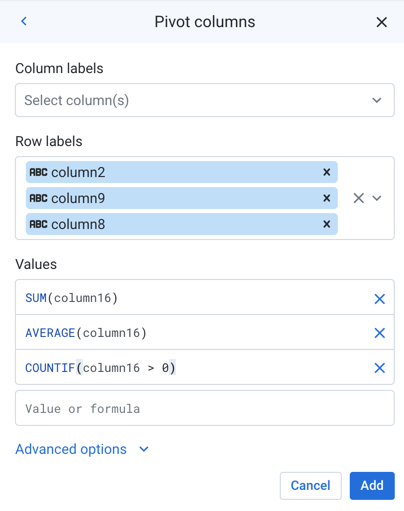
Create a summary: Add the following steps to the recipe to generate a useful summary by aggregating, averaging and counting the contributions in column 16 and grouping on the candidates by IDs, names, and party affiliation in columns 2, 9, 8 respectively. Click New Step in the Recipe panel. Then, copy the following step and paste it into the Search box:
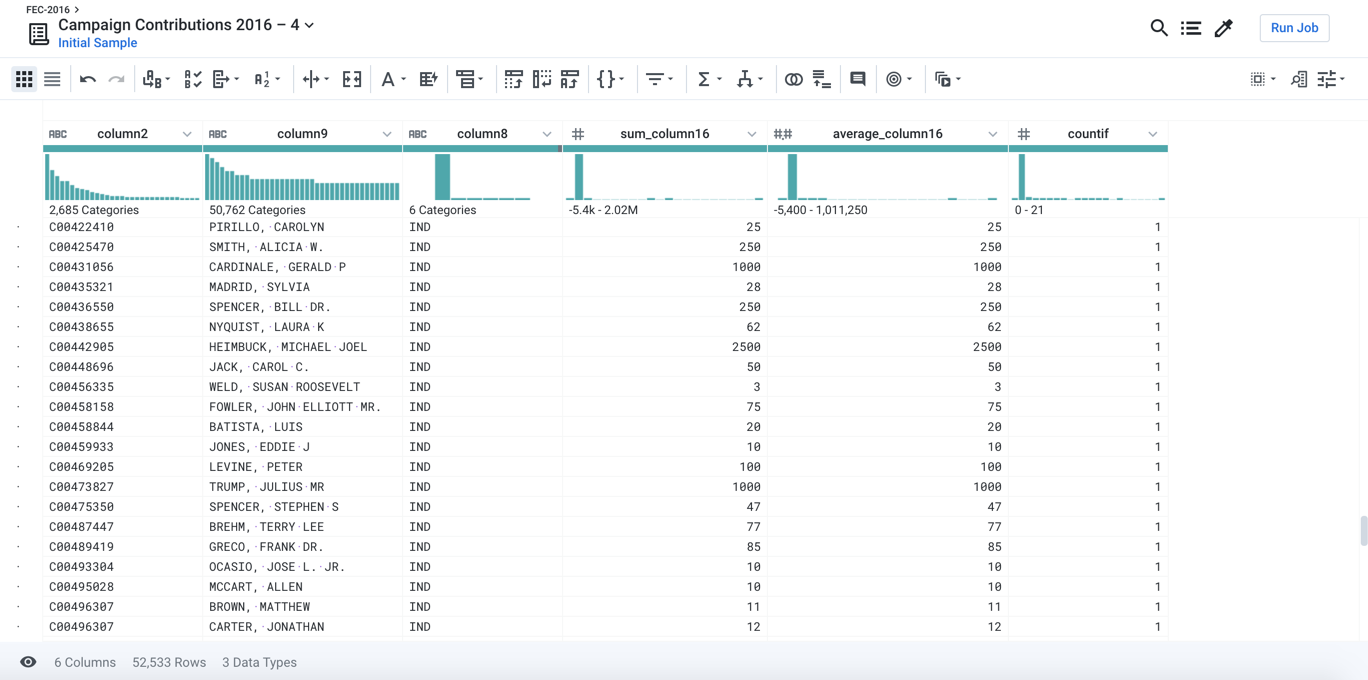
pivot value:sum(column16),average(column16),countif(column16 > 0) group: column2,column9,column8
A sample of the joined and aggregated data is displayed, representing a summary table of US presidential candidates and their 2016 campaign contribution metrics.
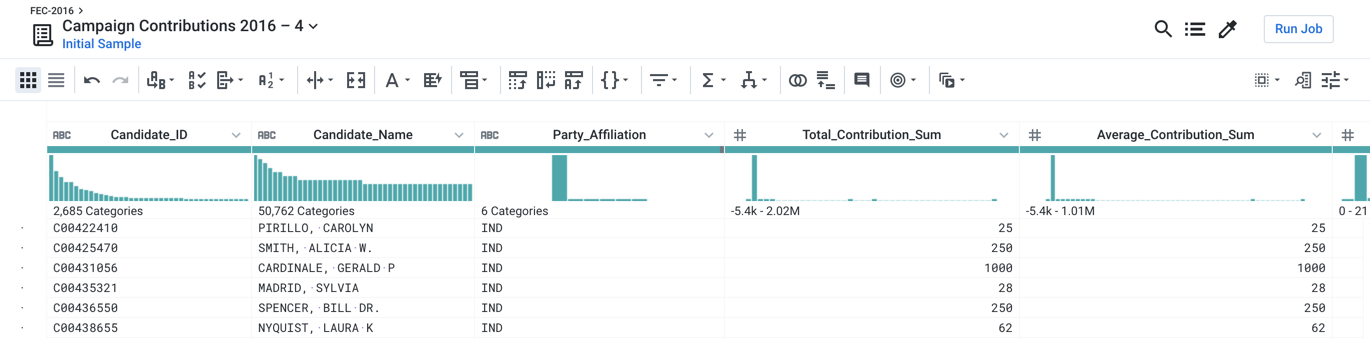
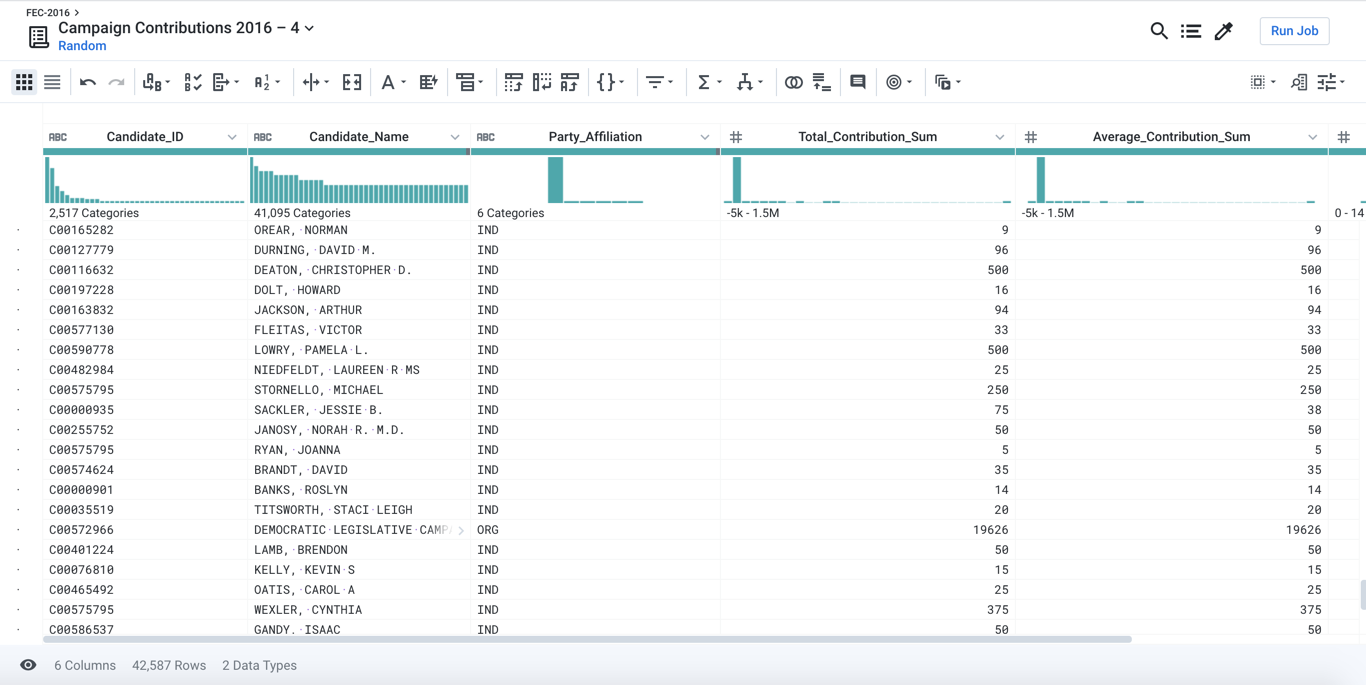
You can make the data easier to interpret by adding the following renaming and rounding steps to the recipe.
rename type: manual mapping: [column9,'Candidate_Name'],
[column2,'Candidate_ID'],[column8,'Party_Affiliation'],
[sum_column16,'Total_Contribution_Sum'],
[average_column16,'Average_Contribution_Sum'],
[countif,'Number_of_Contributions']
set col: Average_Contribution_Sum value: round(Average_Contribution_Sum)
Gather new samples
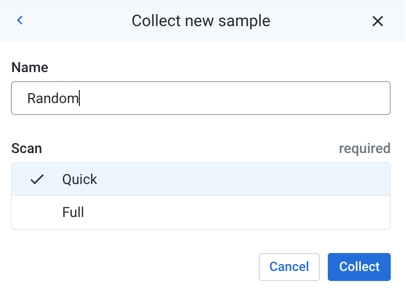
As needed, you can generate a different kind of sample of your data, which helps to locate outliers and to verify that your transformation steps apply to all rows in the dataset. To view more data, click the "Initial Sample" link at the top-left of the page. In the Samples pane. select a random, quick sample, then click Collect.
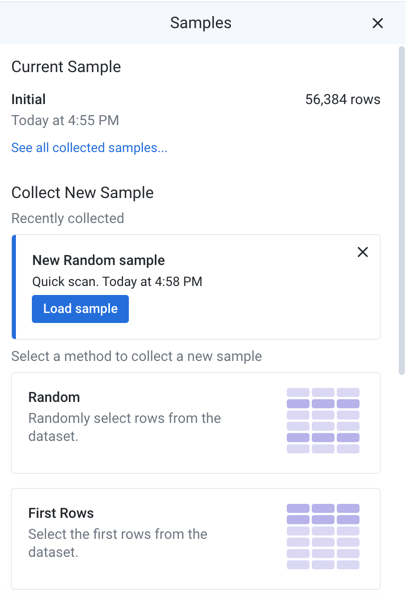
In the Samples pane. select a random sample. For the scan type, select Quick. You can name the sample if needed. Then, click Collect.
After the job completes, click Load Sample in the Samples panel to load the
new sample into the Transformer page.
Run a job
You can now run a job to apply your changes across the entire joined dataset. In the Transformer page, click Run Job.
In the Run Job on Dataflow page:
- Select the Profile Results checkbox. When a profile is generated, you can review a statistical and visual summary of the results of your job, which is useful for evaluating the quality of your transformations.
- By default, a CSV file is generated with your job. Suppose you want to add a JSON output file, too. Click Add Publishing Action.
- Click Create a new file.
- Specify a new name for the file if desired.
- For the Data Storage Format, select JSON from the drop-down.
- You can explore the other options if you want. Click Add. The publishing action is added to your job specification.
- Click Run Job.
- The job is queued for execution in Cloud Dataflow.
Tracking progress: In Flow View, you can see the progress of the job in the right panel. To explore details, click the Job Id link.
Profile: When the job completes successfully, click the Profile tab to see the visual profile of your job results.
Export Results: Click the Output Destinations tab. The output files are listed. From a file's context menu, you can click View on Google Cloud Storage. You can download from there.