Cloud Code lets you debug an application deployed to a
Google Kubernetes Engine (GKE) cluster by leveraging
skaffold debug.
You can debug your application on a local cluster (like minikube or Docker Desktop), GKE, or any other cloud provider.
With Cloud Code's debugging support, you don't have to complete
manual setup like setting up port forwarding or injecting language-specific
debug arguments. Debugging requires a Cloud Code-ready
GKE application that includes a skaffold.yaml
configuration file and a cloudcode.kubernetes launch configuration.
Debug a GKE application
To begin debugging your GKE application, follow these steps:
In the Cloud Code status bar, click the active project name.

In the Quick Pick menu that appears, select Debug on Kubernetes.
If prompted, authenticate your credentials to run and debug an application locally.
If your application doesn't have the necessary Skaffold configuration or
cloudcode.kuberneteslaunch configuration, Cloud Code helps you set these up.Confirm whether to use the current Kubernetes context to run the app in (or switch to a preferred one).
If you chose a remote cluster as the context, when prompted, choose an image registry to push the images to.
If your project has Artifact Registry API enabled and at least one Artifact Registry repository, you can browse to and select an existing Artifact Registry repository.
The following samples demonstrate how to specify where container images are stored for some common registries:
Artifact Registry REGION-docker.pkg.dev/PROJECT_ID/REPO_NAMEDocker Hub docker.io/ ACCOUNT
Make sure that you're properly authenticated if you're using a private Docker Hub repository.AWS Container Repository (ECR) AWS_ACCOUNT_ID.dkr.ecr.REGION.amazonaws.com/APPAzure Container Registry (ACR) ACR_NAME.azurecr.io/APPTo generate the final image repository name, Cloud Code concatenates this image registry with the image name specified in the Kubernetes manifests. This choice is stored in your
cloudcode.kuberneteslaunch configuration (found in.vscode/launch.json).For more information, see the image registry handling guide.
Cloud Code builds your containers, pushes them to the registry, applies Kubernetes configurations to the cluster, and waits for the rollout.
After the rollout, Cloud Code automatically port-forwards all declared container ports to your machine and displays the URLs in the output window so that you can browse your live application.
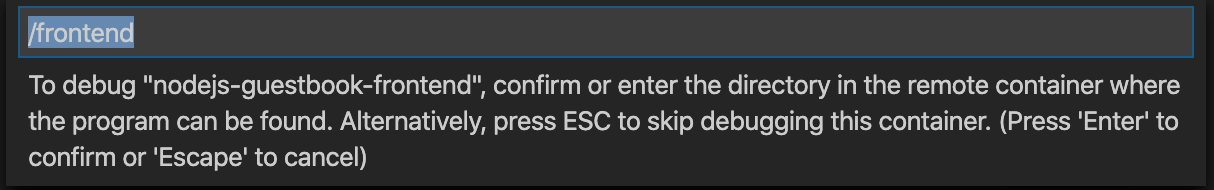
For each debuggable container in your application, confirm or enter the directory in the remote container where the program you want to debug is located.
Alternatively, you can press ESC to skip debugging the container.
Cloud Code attaches a debug session for each debuggable container in the application.
You can now perform the same tasks you normally do when debugging local code, like setting breakpoints and stepping through code, against a live Kubernetes cluster.
By default, when you save a change to your application, Cloud Code redeploys your application and sets up a new debug session. You can toggle this feature with the
watchflag in your project's launch configuration.To inspect variables and stack info, use the Debug Sidebar. To interact with the debugging session, use the Debug Console in the bottom pane debugger.
After your session completes, you can use the following contextual menu commands:
- Open Deployment Logs: Open the application logs of a specific deployment with the Cloud Code logs explorer.
- Open Service URL: Open the application service URL of a specific service in a web browser
If you've turned off watch mode in your launch configuration and you want to make changes to your application and rebuild and redeploy the application, in the Development sessions pane, pause on the run action and then click
 Rebuild and redeploy the application.
To end the debugging session, click
 Stop in the Debug Toolbar.
After you end the debugging session, all the deployed Kubernetes resources are deleted from the cluster.
Configuration details
Cloud Code, powered by Skaffold, automatically handles the following configuration details for all supported languages:
- Port forwarding the debug port so that the debugger can be attached.
- Attaching a debugger to one or more debuggable containers in your application.
If your application has multiple debuggable containers (containers whose
language is supported by Cloud Code debug) configured in
skaffold.yaml, then a debugger is attached to each debuggable container. - Persisting source mapping definitions across sessions; you can customize these
definitions by editing your
.vscode/launch.jsonfile directly.
Cloud Code also handles the following language-specific configuration details:
Node.js
Rewriting the entrypoint to invoke:
node --inspect=localhost:9229
Python
Installing the ptvsd module
using an Init Container and rewriting the entrypoint to invoke:
python -m ptvsd --host localhost --port 5678
Go
Installing the
dlv debugger
using an Init Container and rewriting the entrypoint such that the launched
debug session runs with a debug server only (in headless mode), continues the
debugged process on start, accepts multiple client connections, and listens at
localhost:56268:
dlv exec --headless --continue --accept-multiclient --listen=localhost:56268 --api-version=2, <app> --
Java
Adding an environment JAVA_TOOLS_OPTIONS with the appropriate Java Debug
Wire Protocol (JDWP) configuration such that the JDWP debugging agent listens
for a socket connection on port 5005 and allows the VM to begin executing
before the debugger is attached:
jdwp=transport=dt_socket,server=y,suspend=n,address=5005,quiet=y
For more details on Skaffold-powered debugging, see the
skaffold debug documentation.
Set up your container
To prepare your container for debugging, follow the instructions for the language you're using:
Node.js
- Start the Node.js application with
--inspect=<debugPort>wheredebugPortcomes from the attach configuration. For example:CMD ["node", "--inspect=9229", "index.js"]
Python
- Make sure that you have the
ptvsdmodule installed on your machine and in your container. - Start the Python application through
ptvsd. Match the port specified to thedebugPortfield in the attach configuration. For example:CMD ["python", "-m", "ptvsd", "--port", "
" , "app.py"]
Go
- Make sure that you have the
dlvpackage installed on your machine and your Go container. Start your Go application through
dlv debug.The port specified in the starting command should be the same as the
debugPortattribute value in the attach configuration. For example:CMD ["dlv", "debug", "--headless", "--listen=:<debugPort>", "--log"]
Troubleshooting Tip: When debugging a Go application, the application will stop and wait for a debugger to attach. Attach a debugger for the service to start.
Java
- Make sure that JVM is installed on your machine.
Start the Java application with the following options, where
debugPortcomes from the attach configuration.-agentlib:jdwp=transport=dt_socket,server=y,suspend=n,address=
,quiet=y For example, to start the Java application in debug mode and listen on port
debugPortfor connection:ENTRYPOINT ["java","-agentlib:jdwp=transport=dt_socket,server=y,suspend=n,address=<debugPort>,quiet=y", "-jar", "my-app-1.0.jar"]
.NET Core
Make sure that you have the
vsdbg, the .NET Core command line debugger from Microsoft, installed on your Kubernetes container.For example:
RUN apt-get update

  && apt-get install -y --no-install-recommends unzip

  && apt-get install -y procps

  && rm -rf /var/lib/apt/lists/*

  && curl -sSL https://aka.ms/getvsdbgsh | bash /dev/stdin -v latest -l /dbg/netcore/vsdbg
Set up your attach configuration
To attach to a debuggable container, you need to have an
attach configuration
of type cloudcode.kubernetes.
Add a .vscode/launch.json file
If your project doesn't have a launch.json file in its .vscode
folder, you can add one using the Debug panel.
To navigate to the Debug panel, click
 Run and Debug
in the Activity bar.
Run and Debug
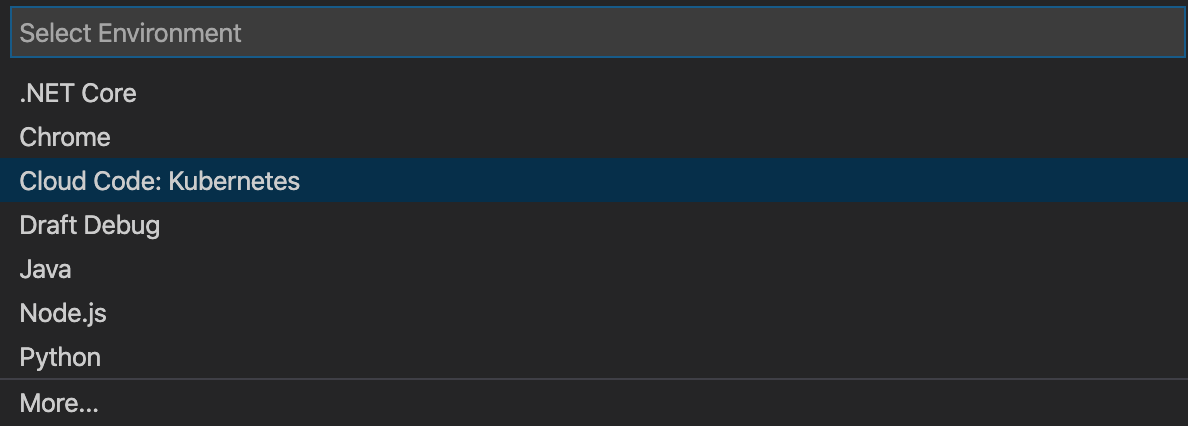
in the Activity bar.Select Add Configuration from the drop-down menu.
Select Cloud Code: Kubernetes as the environment.
Select the Attach to Kubernetes Pod option.
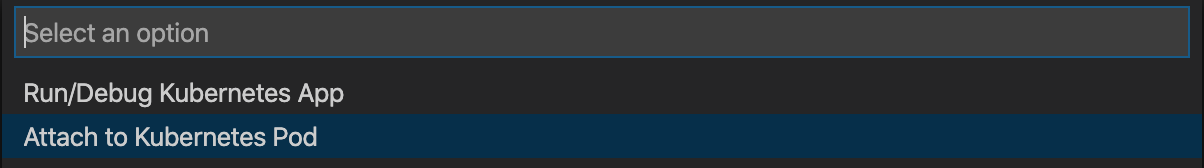
Select the programming language you're using.
This creates and opens a
launch.jsonfile for your project and creates an attach configuration for you.Update configuration attributes in the
launch.jsonfile to match those of your project. For more information on configuration attributes, see Configuration attributes.
Add an attach configuration to your .vscode/launch.json file
To add a new attach configuration to an existing .vscode/launch.json file:
- Open the
launch.jsonfile. - To invoke the snippet Intellisense, click Add Configuration.
- To add an attach configuration, select the Cloud Code: Attach to Kubernetes Pod snippet for the language you're using.
- Update attributes in the configuration to match those of your project. For more information on configuration attributes, see Configuration attributes.
Configuration attributes
| Attribute | Description |
|---|---|
| debugPort | Debug port used on the container. |
| podSelector | Set of key-value pairs used to select the debug pod. For more
information, see the
guide on selectors).
The following sample shows a typical podSelector:
  "podSelector": {
    "app": <deployment-name>
  }
|
| localRoot | Path to the local directory containing the program being debugged. Defaults to ${workspaceFolder}. |
| remoteRoot | Absolute path to the remote directory containing the program being debugged (on the Kubernetes container). |
Attach a debugger to your Kubernetes pod
Cloud Code for VS Code supports attaching a debugger to a Kubernetes pod for
Node.js, Python, Go, Java and .NET. All you need is a
debuggable container and an
attach configuration of type
cloudcode.kubernetes.
For information about how attaching to a Kubernetes pod differs from debugging a Kubernetes application, see How attaching a debugger to a pod differs from debugging a Kubernetes application.
To attach a debugger to your Kubernetes pod, perform the following tasks:
- To navigate to the Debug panel, click
Run and Debug
in the Activity bar.
Select and launch the configuration by pressing
F5.localhost:${debugPort}is port-forwarded todebugPorton the container while debugging.
The debugging session is now successfully set up. You can perform the tasks you normally do when debugging local code, like setting breakpoints and stepping through code.
To inspect variables and stack info, use the Debug Sidebar. To interact with the debugging session, use the Debug Console in the bottom pane debugger.
To end the debugging session, click
Stop
in the Debug Toolbar.
How attaching a debugger to a pod differs from debugging a Kubernetes application
| Attach to a Kubernetes pod | Debug a Kubernetes application |
|---|---|
| Debugs a single Kubernetes pod. | Debugs all the debuggable containers in the application. |
| The application must be running in the Kubernetes pod before debugging. | Runs the application on the Kubernetes cluster and attaches the debugger. |
Uses configuration (.vscode/launch.json) of type cloudcode.kubernetes and request attach.
|
Uses configuration (.vscode/launch.json) of type cloudcode.kubernetes and request launch.For more information, see Launch versus attach configurations. |
Sample Config:
{
  "name": "Attach to Kubernetes Pod (NodeJS)",
  "type": "cloudcode.kubernetes",
  "request": "attach",
  "language": "Node",
  "debugPort": 9229,
  "podSelector": {
     "app": "hello-world"
  },
  "localRoot": "${workspaceFolder}",
  "remoteRoot": "/app"
}
|
Sample Config:
{
  "name": "Run/Debug on Kubernetes",
  "type": "cloudcode.kubernetes",
  "request": "launch",
  "skaffoldConfig": "${workspaceFolder}/skaffold.yaml",
  "watch": true,
  "cleanUp": true,
  "portForward": true
}
|
| This configuration can't be used to run the application. | This configuration can be used to run or debug the application. |
| This configuration is language specific. | This configuration is not language specific. |
| No dedicated command. | Debug on Kubernetes command. |
| Watch mode isn't available, so after making changes you restart the debugger manually. | Watch mode lets Cloud Code restart the debugger after you save changes. |
What's next
- Use file sync and hot reloading to speed up development.
- Set up a continuous development environment in Cloud Code.
- View Kubernetes logs in Cloud Code.