IntelliJ용 Cloud Code를 사용하면 Kubernetes 클러스터에 배포된 애플리케이션을 쉽게 디버깅할 수 있습니다. Minikube 또는 Docker Desktop과 같은 로컬 클러스터, Google Kubernetes Engine 또는 다른 클라우드 제공업체에서 애플리케이션을 디버깅할 수 있습니다.
Cloud Code의 디버깅 지원을 사용하면 포트 전달 설정, 디버깅 백엔드 설치, 언어별 디버그 인수의 올바른 삽입과 같은 수동 설정을 건너뛸 수 있습니다. skaffold.yaml 구성 파일이 포함된 Cloud Code에 사용 가능한 Kubernetes 애플리케이션만 있으면 됩니다.
또한 Cloud Code를 사용하면 소스 코드를 변경하고 작업을 반복하면서도 애플리케이션을 디버깅할 수 있습니다.
지원되는 IDE
다음 표에서는 Cloud Code에서 디버깅을 위해 지원되는 언어 및 IDE를 보여줍니다. 또한 이 표에서는 필요한 플러그인(해당하는 경우)을 보여줍니다.
| 언어 | 지원되는 IDE 및 버전 | 필수 플러그인 |
|---|---|---|
| 자바 | IntelliJ IDEA Ultimate | N/A |
| IntelliJ IDEA Community | N/A | |
| Go | IntelliJ IDEA Ultimate | Go 플러그인 |
| GoLand | N/A | |
| Node.js | IntelliJ IDEA Ultimate | Node.js 플러그인 |
| WebStorm | N/A | |
| Python | IntelliJ IDEA Ultimate | Python 플러그인 |
| PyCharm Professional | N/A |
IDE 지원에 대한 자세한 내용은 지원되는 JetBrains IDE를 참조하세요.
Cloud Code를 사용하면 다음 언어로 중단점을 설정하고 컨테이너에서 실행 중인 원격 애플리케이션을 디버깅할 수 있습니다.
자바
Cloud Code는 디버깅을 사용 설정하는 적절한 JDWP 구성과 함께 환경 변수 JAVA_TOOL_OPTIONS를 자동으로 추가합니다. JAVA_TOOL_OPTIONS이 이미 있으면 Cloud Code가 JAVA_TOOL_OPTIONS에 지정된 기존 설정을 사용합니다.
Node.js
애플리케이션 구조와 이미지 빌드 구성에 따라 디버거가 로컬 소스를 컨테이너의 원격 소스에 매핑할 수 있도록 해야 할 수 있습니다. 그러면 노드 디버거가 중단점을 올바르게 처리할 수 있습니다.
다음 방법 중 하나로 이를 구성할 수 있습니다.
수동 구성
드롭다운에서 Kubernetes에서 개발 실행 구성을 선택한 후 구성 수정을 클릭합니다. 디버그 탭에서 로컬 애플리케이션 소스에서 원격 컨테이너의 소스 위치로의 소스 매핑을 구성합니다.
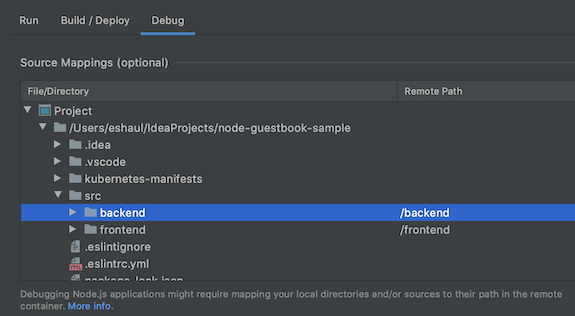
구성 옵션:
- 파일/디렉터리 - Kubernetes에서 실행 중인 애플리케이션의 로컬 파일 또는 디렉터리입니다.
- 원격 경로 - Kubernetes의 컨테이너에서 실행 중인 파일 또는 디렉터리의 경로입니다.
자동 구성
Cloud Code에 대한 이 매핑을 연기하도록 선택할 수 있습니다. 사용자가 디버그 세션을 시작하면 Cloud Code에서 이 매핑을 자동으로 추론하려고 시도합니다. 추론된 매핑이 대화상자에 표시됩니다. 디버깅 중인 각 아티팩트에 대해 하나의 대화상자가 표시됩니다.
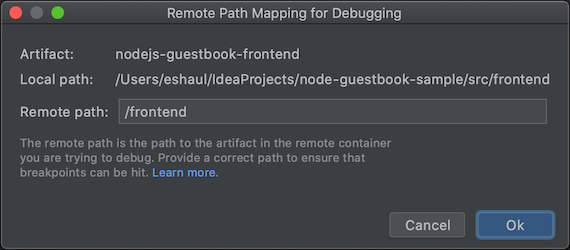
구성 옵션:
- 로컬 경로 - 디버깅 중인 아티팩트의 루트에 대한 로컬 경로입니다.
- 원격 경로 - Kubernetes의 컨테이너에서 실행 중인 파일 또는 디렉터리의 경로입니다. 이를 사용자의 고유 값으로 재정의할 수 있습니다. 취소를 클릭하면 매핑이 적용되지 않습니다.
Go
디버깅을 위해 애플리케이션을 구성하려면 앱이 Go 모듈 기반 애플리케이션이어야 하고 GODEBUG, GOGC, GOMAXPROCS, 또는 GOTRACEBACK과 같이 컨테이너에서 표준 Go 런타임 환경 변수 중 하나를 설정하여 Go 기반 앱으로 식별되어야 합니다. GOTRACEBACK=single이 Go의 기본 설정이며 GOTRACEBACK=all은 일반적으로 유용한 구성입니다.
선택적으로(권장) 최적화를 사용 중지하는 -gcflags='all=-N -l' 옵션을 사용하여 앱을 빌드해야 합니다. Skaffold 프로필은 이 용도에 유용한 옵션이며 빌드/배포 탭의 실행 구성에서 배포 프로필 필드에 설정할 수 있습니다.
Python
디버깅을 위해 애플리케이션을 구성하려면 다음 기본 요건을 충족해야 합니다.
IDE, 버전, 플러그인 호환
호환되는 IDE, 버전, 플러그인은 지원되는 IDE를 참조하세요.
Skaffold 버전 1.25.0 이상
Cloud Code가 종속 항목을 관리하거나 로컬 Skaffold 설치를 가리키도록 할 수 있습니다. 환경설정 > 도구 > Cloud Code > 종속 항목을 참조하세요.
Python 인터프리터 구성됨
Python 인터프리터가 프로젝트에 구성되어 있지 않으면 기본 Python 디버거인
pydevd를 실행할 방법이 없으므로 디버깅이 작동하지 않습니다.IDE 구성 방법 IntelliJ IDEA Cloud Code를 통한 Python 디버깅을 사용하려면 프로젝트에 Python SDK를 구성해야 합니다.
파일 > 프로젝트 구조로 이동하고 프로젝트 탭에서 Python SDK를 추가합니다. 아무것도 없으면 SDK 탭 아래에 추가합니다.PyCharm 파일 > 설정 > 프로젝트 > Python 인터프리터 또는 Mac OS X의 경우 PyCharm > 환경설정 > 프로젝트 > Python 인터프리터로 이동하여 Python 인터프리터를 추가합니다.
자세한 내용은 Skaffold 디버그 문서를 참조하세요.
애플리케이션 디버깅
Kubernetes 클러스터에서 디버그 모드로 개발 주기를 시작하려면
 Kubernetes에서 개발을 위한 디버그 작업을 클릭하세요.
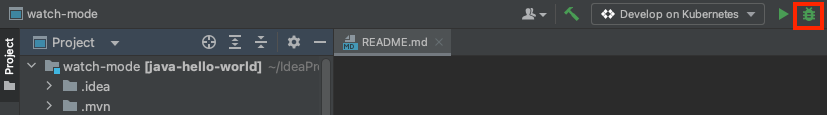
지속적 개발 주기가 디버그 모드로 시작됩니다.
Cloud Code는 디버그 세션을 연결합니다.
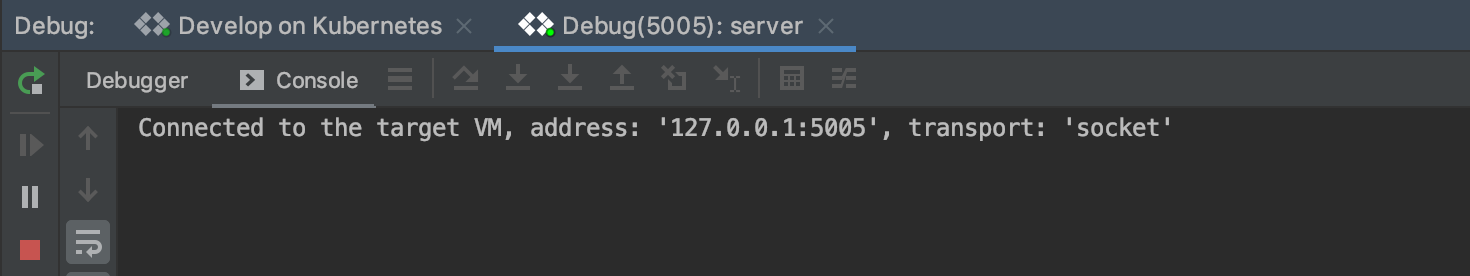
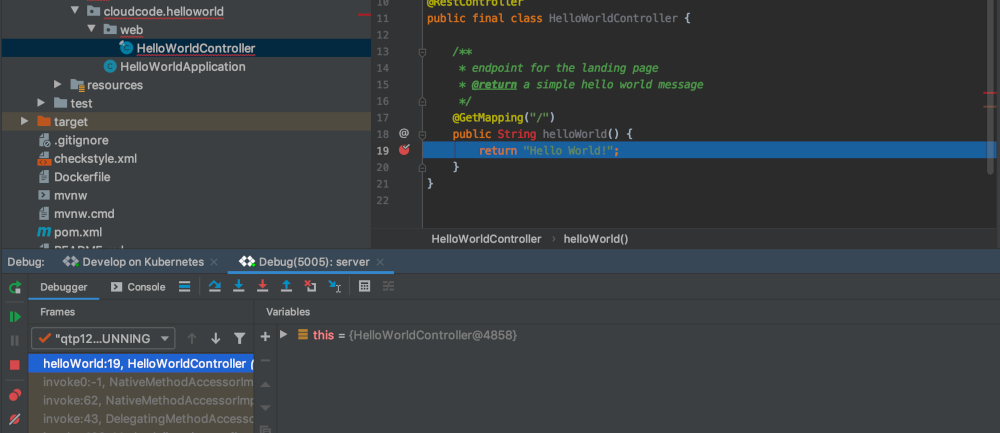
이제 중단점 설정 및 단계별 코드 실행과 같이 실제 Kubernetes 클러스터에 대해 로컬 코드를 디버깅할 때 일반적으로 하는 작업을 수행할 수 있습니다.
디버깅 세션을 종료하려면 Kubernetes에서 개발 실행 구성의 중지 아이콘을 클릭합니다.
다음 단계
- 파일 동기화 및 핫 리로드를 사용하여 개발 속도 높이기
- Cloud Code에서 지속적 개발 환경 설정
- Cloud Code에서 Kubernetes 로그 보기