Ver los resultados de las compilaciones de los activadores de compilación
Organízate con las colecciones
Guarda y clasifica el contenido según tus preferencias.
En esta página se explica cómo ver información sobre tus compilaciones de Cloud Build mediante el panel de control de Cloud Build en la consola de Google Cloud .
El panel de control de Cloud Build ofrece una vista general de las compilaciones más recientes de cada activador de compilación.
El panel de control se organiza en tarjetas, donde cada tarjeta está asociada a un activador de compilación de tu repositorio. Si se crean varios activadores en un mismo repositorio, habrá varias tarjetas. Estas tarjetas se ordenan alfabéticamente por el nombre del repositorio, seguido del nombre del activador. También puedes fijar cualquier tarjeta en la parte superior de la página colocando el cursor sobre el lado derecho de la tarjeta y haciendo clic en el icono de la chincheta, como se indica en el ejemplo siguiente:
Las tarjetas se titulan con los resultados más recientes de la compilación, como Correcto o Fallido. El nombre del repositorio y el del activador se corresponden con el resultado del último resultado. Debajo del título, la tarjeta resume los resultados relacionados con tus compilaciones más recientes.
Consultar el panel de control
El panel de Cloud Build se rellena si has configurado activadores de compilación. Para obtener más información sobre cómo configurar activadores de compilación, consulta Crear y gestionar activadores de compilación.
Para ver el panel de control de Cloud Build, sigue estos pasos:
Ve a la página del panel de control de Cloud Build:
Verás el panel de control de Cloud Build con una lista de las compilaciones recientes de tus activadores de compilación.
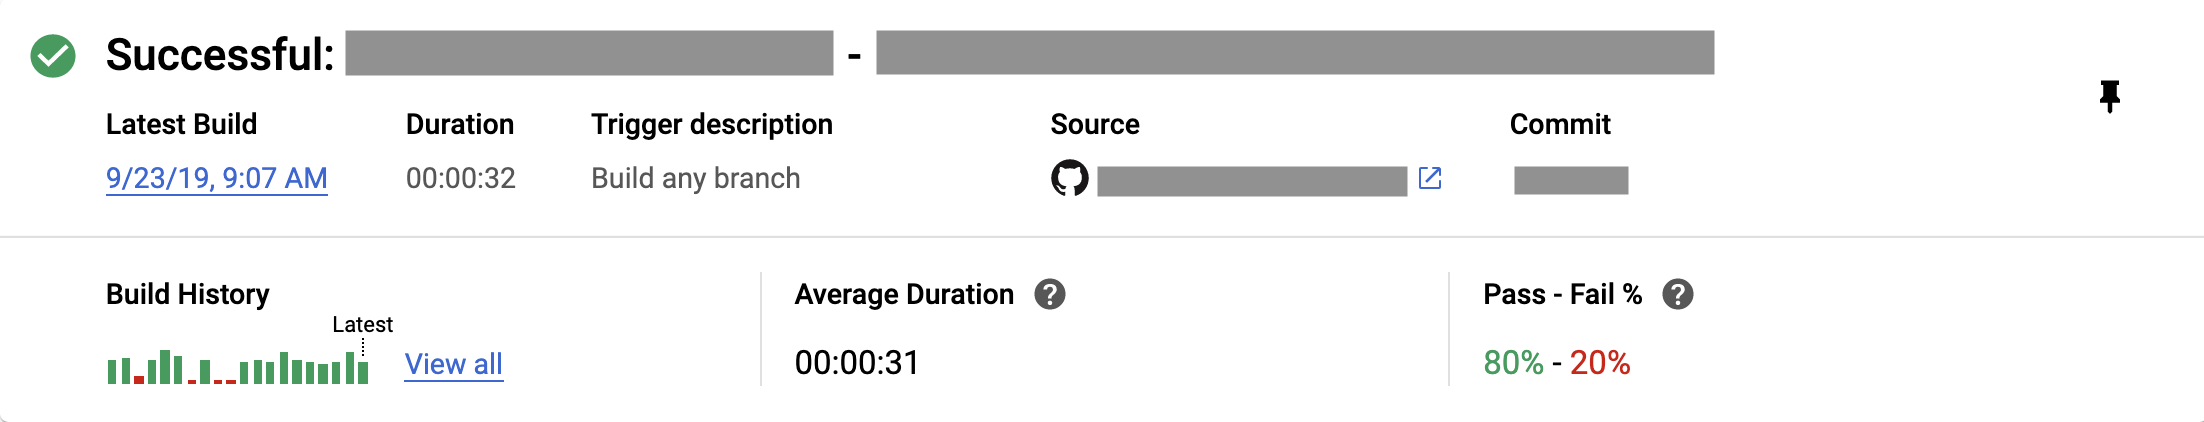
En el panel de control de Cloud Build se muestra la siguiente información:
Última compilación: la fecha y la hora de tu compilación más reciente.
Duración: la duración de la compilación más reciente, en formato HH:MM:SS.
Fuente: enlace a tu repositorio de origen conectado. El repositorio de origen puede ser un repositorio de Cloud Source, un repositorio de GitHub o un repositorio de Bitbucket.
Confirmación: enlace a la confirmación que se ha usado para tu compilación.
Paso fallido: el paso que ha fallado y que ha provocado el fallo de la compilación, si la compilación más reciente ha fallado.
Si la compilación más reciente ha fallado, Paso fallido se vinculará al paso que ha provocado el fallo en el registro de compilación.
Historial de compilaciones: un gráfico de barras que representa la duración de las 20 compilaciones más recientes. Puedes colocar el cursor sobre cada barra del gráfico para ver información sobre cada compilación.
Duración media: tiempo de ejecución medio de las 20 compilaciones más recientes, sin incluir las que aún están en curso.
Si la duración media de tu compilación supera los 10 minutos y el tipo de máquina que has especificado para tu compilación es E2_MEDIUM, E2_HIGHCPU_8 o N1_HIGHCPU_8, verás el botón MEJORAR VELOCIDAD. Puedes hacer clic en MEJORAR VELOCIDAD para ver recomendaciones sobre cómo mejorar la velocidad de tu compilación. Para obtener más información, consulta el artículo Prácticas recomendadas para acelerar las compilaciones.
Porcentaje de éxitos y fracasos: la media de la proporción de éxitos y fracasos de tus 20 compilaciones más recientes.
Tarjetas de filtro
Para filtrar las tarjetas de tu panel de control, haz clic en la opción Filtrar activadores en la parte superior de la página del panel de control de Cloud Build:
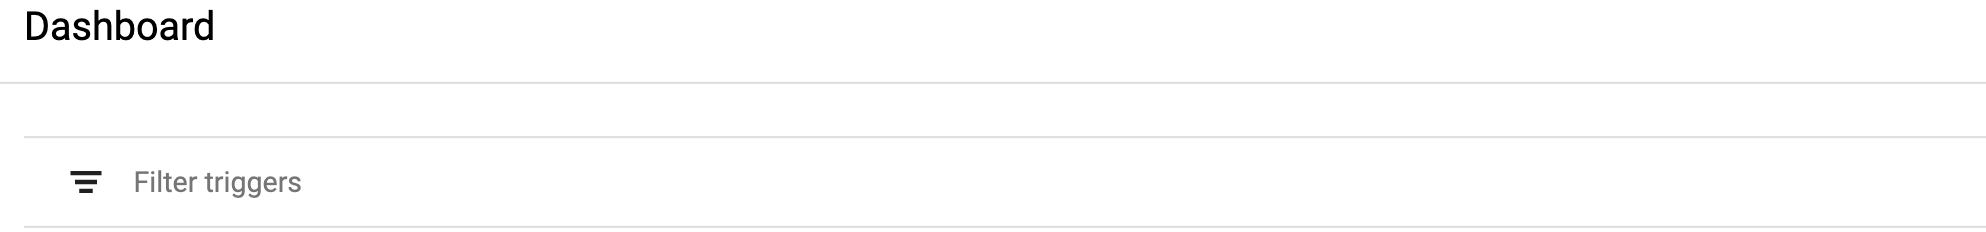
Puedes filtrar las tarjetas por lo siguiente:
Origen del activador: el nombre del repositorio de origen.
Nombre del activador: el nombre del activador.
Descripción del activador: la descripción del activador.
[[["Es fácil de entender","easyToUnderstand","thumb-up"],["Me ofreció una solución al problema","solvedMyProblem","thumb-up"],["Otro","otherUp","thumb-up"]],[["Es difícil de entender","hardToUnderstand","thumb-down"],["La información o el código de muestra no son correctos","incorrectInformationOrSampleCode","thumb-down"],["Me faltan las muestras o la información que necesito","missingTheInformationSamplesINeed","thumb-down"],["Problema de traducción","translationIssue","thumb-down"],["Otro","otherDown","thumb-down"]],["Última actualización: 2025-08-21 (UTC)."],[[["\u003cp\u003eThe Cloud Build dashboard in Google Cloud console provides a summary of recent builds, organized by build triggers.\u003c/p\u003e\n"],["\u003cp\u003eEach card on the dashboard represents a build trigger and displays the latest build outcome, repository, trigger name, and summary of recent results.\u003c/p\u003e\n"],["\u003cp\u003eThe dashboard includes details like the latest build's date, duration, source, commit, any failed step, a build history bar chart, average duration, and pass/fail percentage.\u003c/p\u003e\n"],["\u003cp\u003eYou can filter cards on the dashboard by trigger source, name, and description to narrow down the information displayed.\u003c/p\u003e\n"],["\u003cp\u003eUsers can also pin specific cards to the top of the page to keep track of important build triggers.\u003c/p\u003e\n"]]],[],null,["# View build results for build triggers\n\nThis page explains how to view information about your Cloud Build\nbuilds using the [Cloud Build dashboard](http://console.cloud.google.com/cloud-build/dashboard) in Google Cloud console.\n\nThe Cloud Build dashboard provides a high-level overview of your most recent builds for each build\ntrigger.\n\nThe dashboard is organized by cards, where each card is associated with a\nbuild trigger in your repository. If there are multiple triggers\ncreated in a single repository, there will be multiple cards. These cards are\nordered alphabetically by the name of your repository followed by the name\nof the trigger. You can also pin any card to the top of the page by hovering over\nthe right side of the card and clicking on the pin icon as indicated in the\nexample below:\n\nCards are titled by the latest outcomes of the build, such as **Successful** or\n**Failed**. The name of the repository and the trigger name follow the\nresult of the latest outcome. Under the title, the card summarizes results\nrelated to your most recent builds.\n\nView the dashboard\n------------------\n\nThe Cloud Build dashboard is populated if you have build triggers\nset up. To learn more about how to set up build triggers, see [Creating and managing\nbuild triggers](/build/docs/running-builds/create-manage-triggers).\n\nTo view the Cloud Build dashboard:\n\n1. Go to the Cloud Build dashboard page:\n\n \u003cbr /\u003e\n\n [Open the Cloud Build dashboard page](https://console.cloud.google.com/cloud-build)\n\n \u003cbr /\u003e\n\n2. Select your project from the drop-down menu.\n\nYou will see the Cloud Build dashboard listing recent builds for your\nbuilds triggers.\n\nThe Cloud Build dashboard displays the following information:\n\n- **Latest build**: The date and time of your most recent build.\n\n- **Duration** : The duration of your most recent build, in `HH:MM:SS` format.\n\n- **Source** : Links to your connected source repository. Your source repository\n can either be a [Cloud Source Repository](/../source-repositories/docs/create-code-repository),\n a GitHub repository, or a Bitbucket repository.\n\n- **Commit**: Links to the commit that was used for your build.\n\n- **Failed Step**: The failed step that resulted in the build failure, if\n your most recent build has failed.\n\n If your most recent build has failed, **Failed step** will link to the step that\n caused the failure in your build log.\n- **Build History**: A bar chart representing the build duration for your 20 most recent\n builds. You can hover over each bar in the bar chart to view information about each\n individual build.\n\n- **Average Duration**: The average runtime of your 20 most recent builds, not\n including builds that are still running.\n\n If the average duration of your build time exceeds 10 minutes and the\n [machine type](/build/docs/api/reference/rest/v1/projects.builds#machinetype)\n you specified for your build is `E2_MEDIUM`, `E2_HIGHCPU_8`\n or `N1_HIGHCPU_8`, you will see\n the **IMPROVE SPEED** button. You can click on **IMPROVE SPEED** to view\n recommendations on how to improve the speed of your build. To learn more,\n see [Best practices for speeding up builds](/build/docs/speeding-up-builds).\n- **Pass - Fail %**: The average pass/fail ratio of your 20 most recent builds.\n\nFilter cards\n------------\n\nTo filter cards on your dashboard, click the **Filter triggers** option at the\ntop of the Cloud Build dashboard page:\n\nYou can filter cards by:\n\n- **Trigger source**: the name of your source repository.\n- **Trigger name**: the name of your trigger.\n- **Trigger description**: the description of your trigger.\n\nWhat's next\n-----------\n\n- Learn how to [store and view build logs](/build/docs/securing-builds/store-view-build-logs).\n- Learn how to [configure notifications using the Slack notifier](/build/docs/configuring-notifications/configure-slack).\n- Learn how to [configure notifications using the SMTP notifier](/build/docs/configuring-notifications/configure-smtp).\n- Learn how to [troubleshoot build errors](/build/docs/troubleshooting)."]]